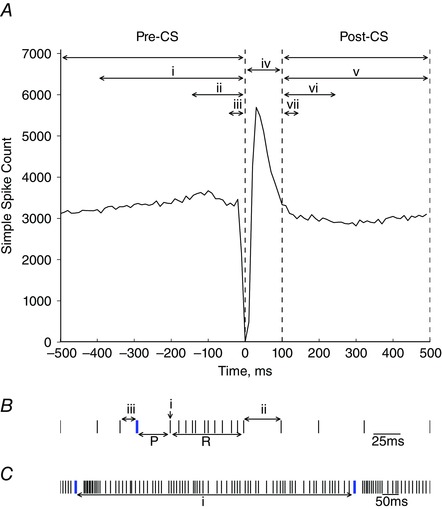
Figure 2. Features of Purkinje cell activity analysed in relation to spikelet number.

A, PETH of simple spike activity around the time of the complex spikes (time = 0 ms). Spikelet number was compared with the simple spike rate before the complex spike in three epochs: (i) –400 to 0 ms; (ii) –150 to 0 ms; and (iii) –50 to 0 ms. (iv) The time interval 0–100 ms after the complex spike that represents the average post‐complex spike pause and rebound in simple spike activity. Spikelet number was also compared with the simple spike rate after the complex spike in three epochs: (v) 100 to 500 ms; (vi) 100 to 250 ms; and (vii) 100 to 150 ms. B, schematic raster plot showing simple spikes (black) and complex spikes (blue). Pause duration (P) is calculated as the time from the initial spike in the complex spike to the subsequent simple spike. Rebound duration (R) is defined as the time from the first simple spike after the complex spike (i) to the next simple spike where ISISS is equal to, or greater than the mean ISISS (ii). The interspike interval between the simple spike and complex spike (ISISS‐CS) is represented by (iii). C, the interspike interval between complex spikes (ISICS‐CS) is illustrated by (i).
