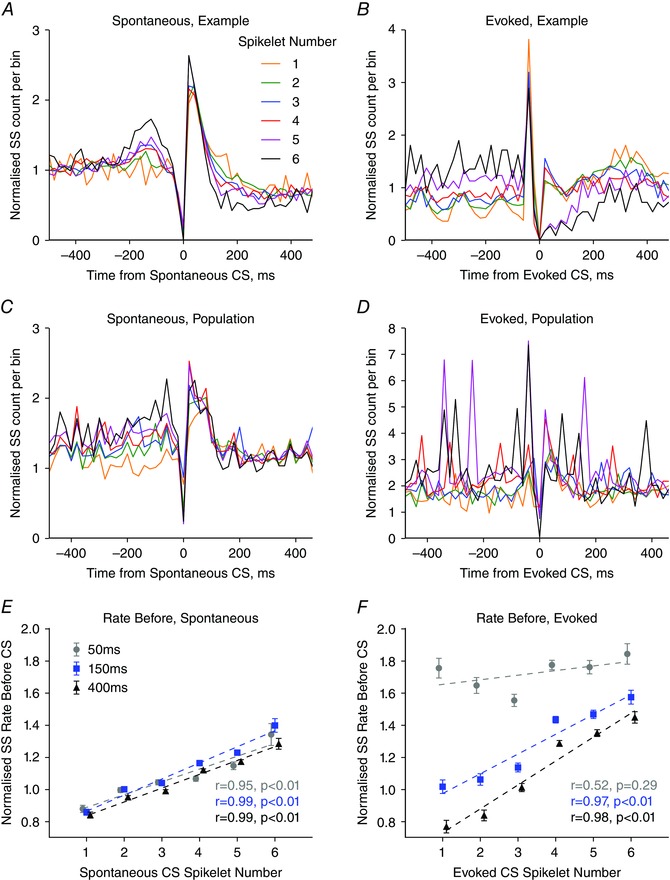
Figure 3. Complex spike spikelet number correlates with simple spike activity.

A and B, example simple spike PETH from single Purkinje cell recordings showing simple spike activity around spontaneous (A) and evoked (B) complex spikes with each number of spikelets. A bin height of 1 represents mean simple spike rate. Bin width = 20 ms. C and D, as in (A) and (B) but population average normalized simple spike PETHs for (C) spontaneous (n = 61 Purkinje cells) and (D) evoked (n = 27 Purkinje cells) complex spikes for each spikelet number. E, relationship between simple spike rate before the spontaneous complex spikes and spikelet number were positively correlated for the three epochs tested (–50 to 0 ms, grey filled circles; r = 0.955, P = 0.003; –150 to 0 ms blue filled squares; r = 0.988, P < 0.001; –400 to 0 ms, black filled triangles; r = 0.993, P < 0.001, n = 61 Purkinje cells). F, relationship between simple spike rate before the evoked complex spike were positively correlated with spikelet number for two of the three time epochs tested (–50 to 0 ms, grey filled circles; r = 0.517, P = 0.293, –150 to 0 ms blue filled squares; r = 0.967, P = 0.002; –400 to 0 ms, black filled triangles; r = 0.981, P = 0.001, n = 27 Purkinje cells. Linear regression performed on complex spikes with one to six spikelets. Each data point represents the mean across all complex spikes with that spikelet number. Error bars indicate the SEM.
