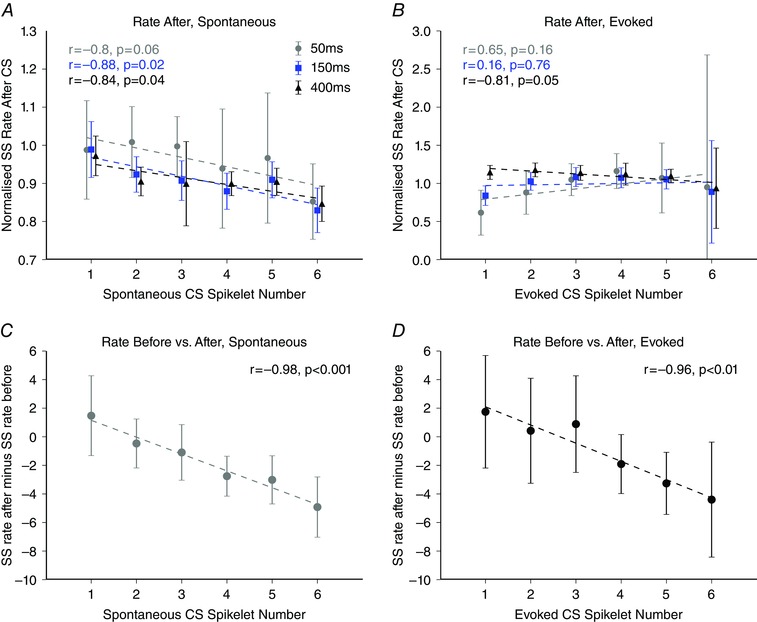
Figure 7. Interactions between spikelet number and simple spike rate after the complex spike.

A, relationship between spikelet number and simple spike rate after spontaneous complex spike events. A negative correlation exists between spontaneous spikelet number and simple spike rate after the complex spike event for two of the three epochs tested (100 to 150 ms, grey filled circles: r = –0.800, P = 0.056; 100 to 250 ms blue filled squares: r = –0.881, P = 0.019; 100 to 500 ms, black filled triangles: r = –0.843, P = 0.035). B, as in (A) but for evoked complex spikes. No correlation was observed for evoked complex spikes (100 to 150 ms, grey filled circles: r = 0.654, P = 0.159; 100 to 250 ms, blue filled squares: r = 0.164, P = 0.756; 100 to 500 ms, black filled triangles: r = –0.812, P = 0.050). C and D, magnitude of simple spike depression following a complex spike event was graded with spikelet number for both spontaneous (r = –0.984, P < 0.001, n = 61 Purkinje cells) and evoked Purkinje cell activity (r = –0.964, P = 0.002, n = 27 Purkinje cells), respectively. Linear regression analysis performed on complex spikes with one to six spikelets. Error bars indicate the SEM.
