
Figure 1. No major change was observed in basal fast excitatory synaptic transmission at PF‐PC synapses in SCA1‐Tg PCs.
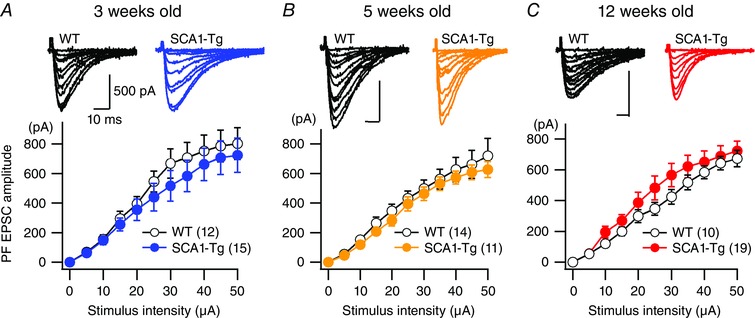
A–C, averaged relationship between stimulus intensity and PF EPSC amplitude of 3‐week‐old (A, presymptomatic), 5‐week‐old (B, early disease stage) and 12‐week‐old (C, middle disease stage) WT (open circles) and SCA1‐Tg (filled circles) mice. Upper panels show representative traces of PF EPSCs. The numbers of tested PCs are indicated in parentheses and all of the data in each condition were obtained from at least three mice in this and subsequent figures and table. At all the ages examined, a repeated‐measures ANOVA indicates no significance for genotype (3 weeks old, F 1,25 = 0.50, P = 0.48; 5 weeks old, F 1,23 = 0.47, P = 0.50; 12 weeks old, F 1,26 = 0.86, P = 0.36) and genotype × stimulus intensity interaction (3 weeks old, F 10,250 = 0.46, P = 0.91; 5 weeks old, F 10,230 = 0.25, P = 0.99; 12 weeks old, F 10,260 = 0.823, P = 0.61). [Colour figure can be viewed at wileyonlinelibrary.com]