
Figure 2. Progressive disruption of mGluR1‐mediated slow EPSCs and synaptic plasticity at PF‐PC synapses in SCA1‐Tg mice.
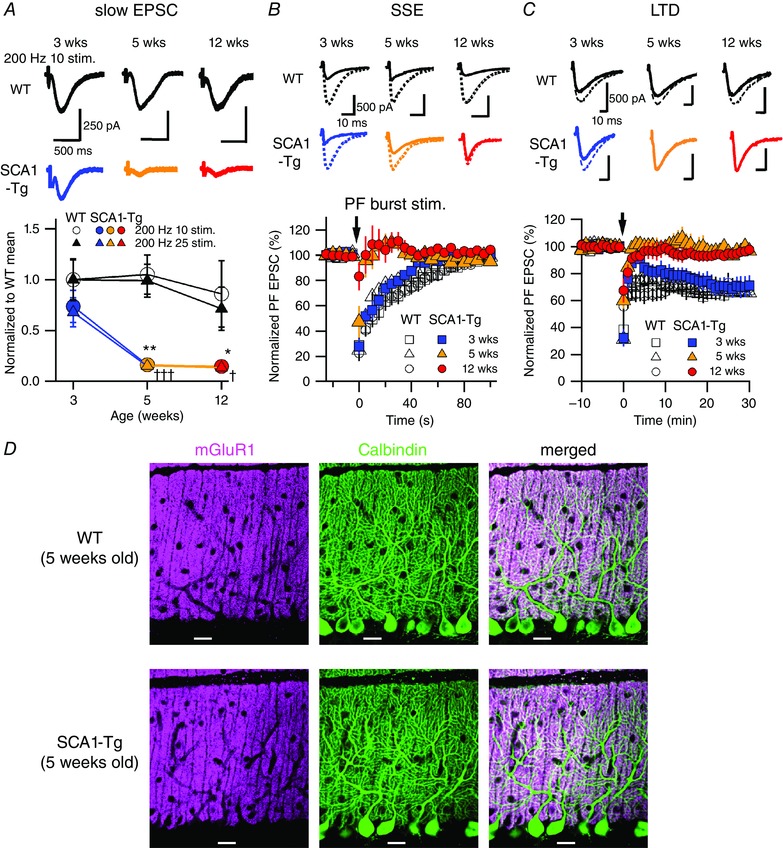
A, traces of mGluR1‐mediated slow EPSCs recorded from PCs in WT mice (top) and in SCA1‐Tg mice (middle) with AMPA receptors blocked by NBQX (20 μm). Stimulus artefacts are partially truncated. Bottom, pooled data of the recorded slow EPSCs normalized to the 3‐week‐old WT mean value in 10 or 25 pulses at 200 Hz. Two‐way ANOVAs with genotype (WT and SCA1‐Tg) and age (3, 5 and 12 weeks old) as factors indicate significant effects of genotype with no significant interaction (genotype × age) in both the stimulus patterns (200 Hz 10 stim.; genotype F 1,64 = 17.16, P = 0.0001; age F 2,64 = 2.21, P = 0.12; interaction F 2,64 = 1.68, P = 0.20; comparison between WT and SCA1‐Tg mice, 3 weeks P = 0.28, 5 weeks ** P < 0.005, 12 weeks * P < 0.05: 200 Hz 25 stim.; genotype F 1,64 = 22.53, P < 0.0001; age F 2,64 = 4.14, P = 0.02; interaction F 2,64 = 1.59, P = 0.21; comparison between WT and SCA1‐Tg mice, 3 weeks P = 0.11, 5 weeks ††† P < 0.001, 12 weeks † P < 0.05). B and C, top and middle, traces of AMPA receptor‐mediated fast PF‐evoked EPSCs before (broken lines) and after (continuous lines) induction of mGluR1‐dependent short‐term (B, SSE; 1st EPSC traces after the PF bursts) and long‐term synaptic plasticity (C, LTD; EPSC traces 30 min after the conjunctive stimuli). Bottom, pooled data of the fast EPSC amplitudes normalized to the baseline period before and after the induction stimuli (arrows) of SSE (B) and LTD (C). D, confocal images of the cerebellar slices double‐immunostained for mGluR1 (magenta) and Calbindin (green; a PC‐specific marker). Scale bars = 20 μm. [Colour figure can be viewed at wileyonlinelibrary.com]