
Figure 3. Progressive impairment of local dendritic Ca2+ signalling at PF‐PC synapses in SCA1‐Tg mice.
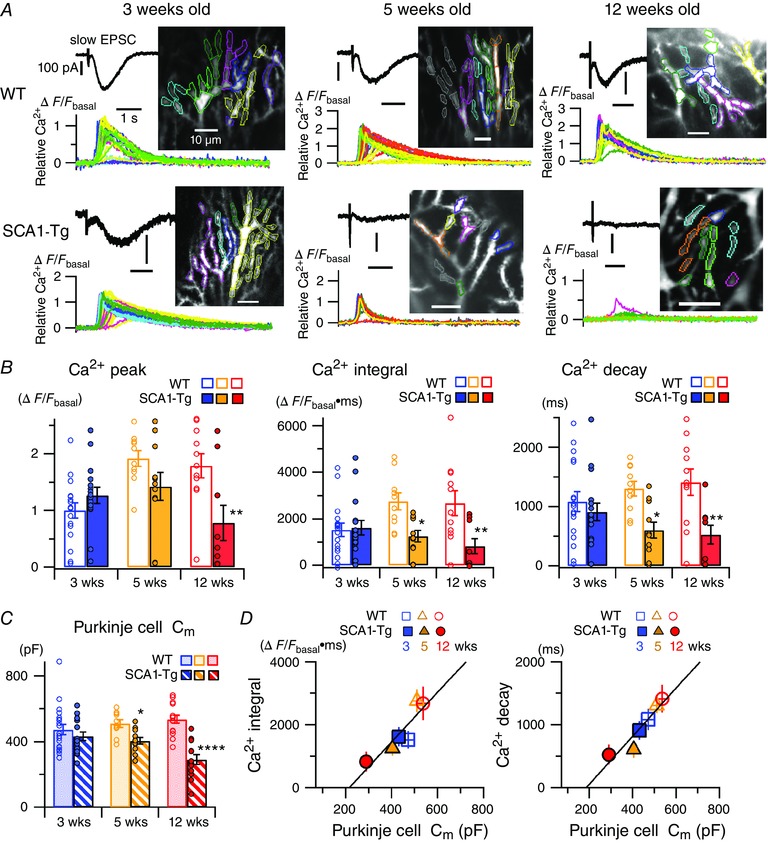
A, traces of mGluR‐mediated PC responses to short PF burst stimulation (10 pulses at 200 Hz) in the presence of NBQX (10–20 μm) and d‐AP5 (50–100 μm). Black and coloured traces show an electrical response (i.e. slow EPSC) and local dendritic Ca2+ signals in a single sweep recording, respectively, in each panel. Inset images show regions of interest (ROIs) on the dendrites of the recorded cells and the individual Ca2+ traces originate from the ROIs with the same colour code in each panel. B and C, pooled data of quantified Ca2+ signals (B, see Methods) and membrane capacitance (C m) (C) of the recorded PCs in 3‐, 5‐ and 12‐week‐old mice. Symbols and bars indicate individual data points and mean values of the data, respectively. Multiple comparisons between WT and SCA1‐Tg mice at each age after two‐way ANOVAs indicate significant differences (* P < 0.05, ** P < 0.005, **** P < 0.0001). All the ANOVAs demonstrate significant genotype effects in Ca2+ peak (F 1,68 = 6.58, P < 0.05), Ca2+ integral (F 1,68 = 13.72, P < 0.0005), Ca2+ decay (F 1,68 = 17.15, P < 0.0001) and C m of PCs (F 1,81 = 31.87, P < 0.0001). D, linear correlation between mean C m values and mean values of the Ca2+ integrals (left, Pearson's correlation coefficient, r = 0.90) or those of the Ca2+ decays (right, r = 0.94). [Colour figure can be viewed at wileyonlinelibrary.com]