
Figure 4. Progressive impairment of motor behaviour in mice expressing virally transduced abnormal Ataxin‐1.
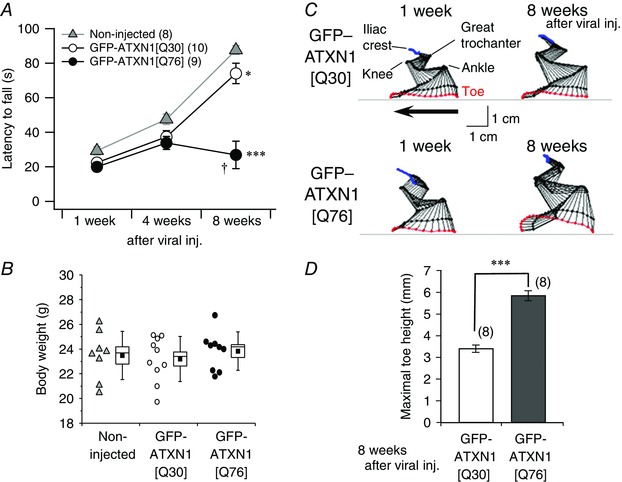
A, averaged data of rotarod performance in naive mice (grey triangles) and age‐matched mice treated with lentiviral vectors expressing normal GFP‐ATXN1[Q30] (open circles) and pathogenic GFP‐ATXN1[Q76] (filled circles) at 1, 4 and 8 weeks after viral injection (viral inj.). The number of mice tested in each group is shown in parentheses. A two‐way repeated measures ANOVA indicates significant effects of genotype (F 2,24 = 21.5, P < 0.0001), time (F 2,48 = 78.0, P < 0.0001) and interaction (F 2,24 = 21.5, P < 0.0001). Multiple comparison tests between genotype at 8 weeks after viral injection show significant differences (* P < 0.05, *** P < 0.0001 in comparison with non‐injected mice; † P < 0.05 compared with GFP‐ATXN1[Q30] mice). B, body weights of the mice not treated and treated with lentiviral vectors expressing GFP‐ATXN1[Q30] or GFP‐ATXN1[Q76] 8 weeks after injection. C, hindlimb kinematic analysis of the mice treated with lentiviral vectors expressing GFP‐ATXN1[Q30] (upper panel) or GFP‐ATXN1[Q76] (lower panel). Stick diagram depicting left hindlimb movement in the mice at 1 and 8 weeks following injection. The arrow indicates the direction of limb movement. D, summary graph showing the maximum toe height of the left hindlimb while walking. *** P < 0.0001. [Colour figure can be viewed at wileyonlinelibrary.com]