
Figure 6. Impairment of mGluR‐mediated slow EPSCs, SSE and LTD at PF‐PC synapses in mice expressing virally transduced abnormal Ataxin‐1.
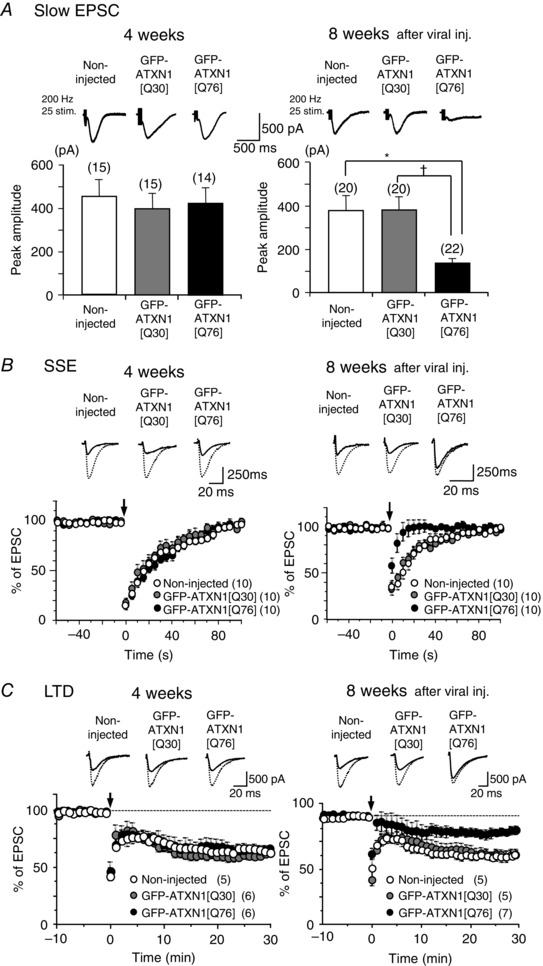
A, upper panel shows representative traces of mGluR‐mediated slow EPSCs recorded from PCs in age‐matched non‐injected mice and those injected with lentiviral vectors expressing non‐pathogenic GFP‐ATXN1[Q30] or abnormal GFP‐ATXN1[Q76]. Stimulus artefacts are partially truncated. Lower panels show pooled data of the slow EPSC amplitudes. * P < 0.01, † P < 0.01; multiple comparison test after one‐way ANOVA. B and C, upper panels show representative traces of AMPA receptor‐mediated fast PF EPSCs before (broken lines) and after (continuous lines) induction of mGluR‐dependent SSE (4 weeks, the first EPSC traces after induction; 8 weeks, the second EPSC traces after induction) or LTD (EPSC traces 30 min after induction). Lower panels show pooled data for the fast PF EPSC amplitudes normalized to the baseline period before and after induction of SSE or LTD at time 0 (arrows).