
Figure 7. Acute bath application of 5 nM baclofen partially enhances remaining mGluR signalling in cerebellar slices of 12‐week‐old SCA1‐Tg mice.
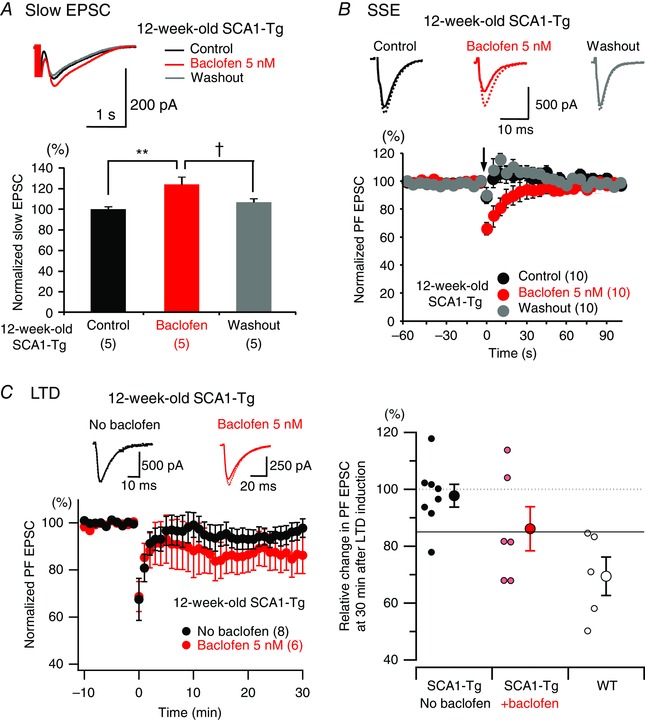
A and B, upper panels show representative traces of remaining slow EPSCs (A, evoked by PF burst stimulation with 25 electrical pulses at 200 Hz; averaged traces from 20 responses) and AMPA receptor‐mediated fast PF EPSCs in SSE experiments (B, broken lines indicate basal PF EPSCs before SSE induction and continuous lines indicate the first EPSCs after the induction) before application (Control, black), in the presence (Baclofen, red) and after washing out (Washout, grey) of 5 nm baclofen. Bar graphs in A show summarized data of the averaged value from 20 responses in each PC of 12‐week‐old SCA1‐Tg mice (** P < 0.01 between Control and Baclofen groups; † P < 0.05 between Baclofen and Washout groups; significance determined by one‐way ANOVA followed by Tukey's post hoc test). Lower panel in B shows the time course of the normalized PF EPSC amplitudes in the SSE experiment of 12‐week‐old SCA1‐Tg mice. C, left upper panel indicates representative basal PF EPSCs (the last EPSC before the induction, broken lines) and the EPSC 30 min after LTD induction (continuous lines). Left lower panel shows the time course of the normalized PF EPSC in LTD experiment of 12‐week‐old SCA1‐Tg mice in the absence and presence of baclofen (5 nm). Baclofen was bath‐applied > 10 min prior to LTD induction. The LTD data set in the absence of baclofen (No baclofen) is the same as presented in Fig. 2 C. Right, relative change in PF EPSC amplitude 30 min after LTD induction in SCA1‐Tg cerebellar slices without baclofen (black filled circles), those in the presence of baclofen (red filled circles) and WT cerebellar slices (open circles). Larger symbols represent mean values and smaller symbols correspond to individual data points. The solid horizontal line indicates 85% relative change, which can be used as a criterion for successful LTD because all the data points in WT range below this line. [Colour figure can be viewed at wileyonlinelibrary.com]