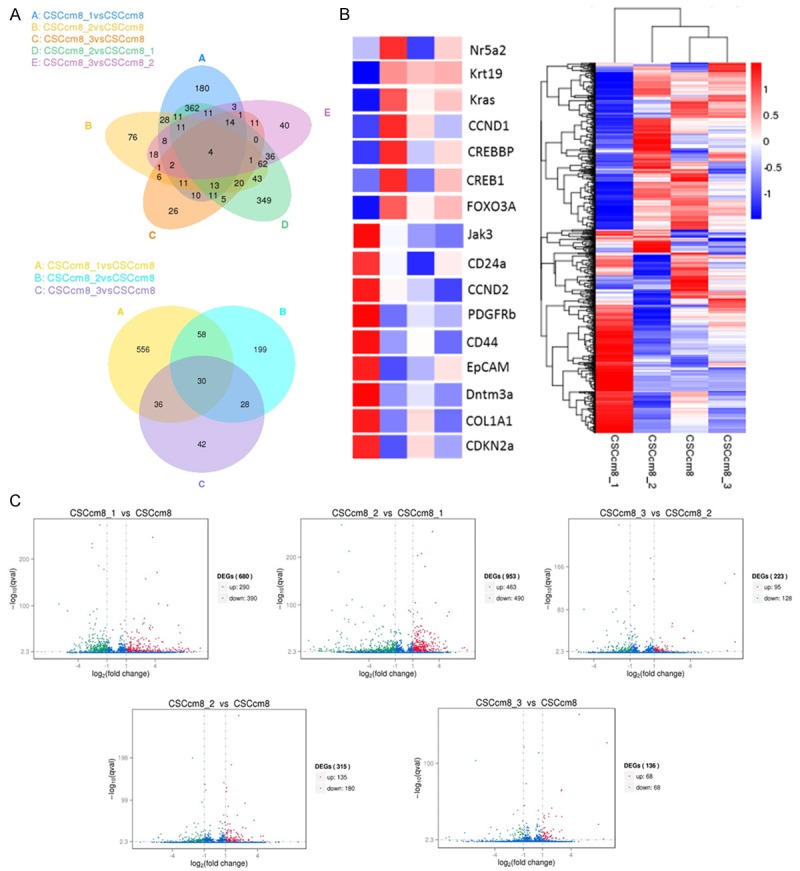
Figure 7.

Molecular characterization. A. Venn diagram shows the differentially expressed genes (DEG) of the 5 possible combinations among the CSCcm PK8 lines (upper), and the combination of 1st CSCcm, 2nd CSCcm and 3rd CSCcm versus the CSCcm (lower). B. Representative cluster analysis among the four CSCcm PK8 lines (right). The colour range represents the log10 (FPKM+1) value from large (red) to small (blue). Main oncogenes and CSCs markers implicated in PDAC carcinogenesis were enlarged (left). C. Volcano plots for the differentially expressed genes screening (DESeq) distributed in significantly up-regulated genes (red), donw-regulated (green) and not differentially expressed (blue). Threshold set as: |log2(FoldChange)| > 1 and qvalue < 0.005.
