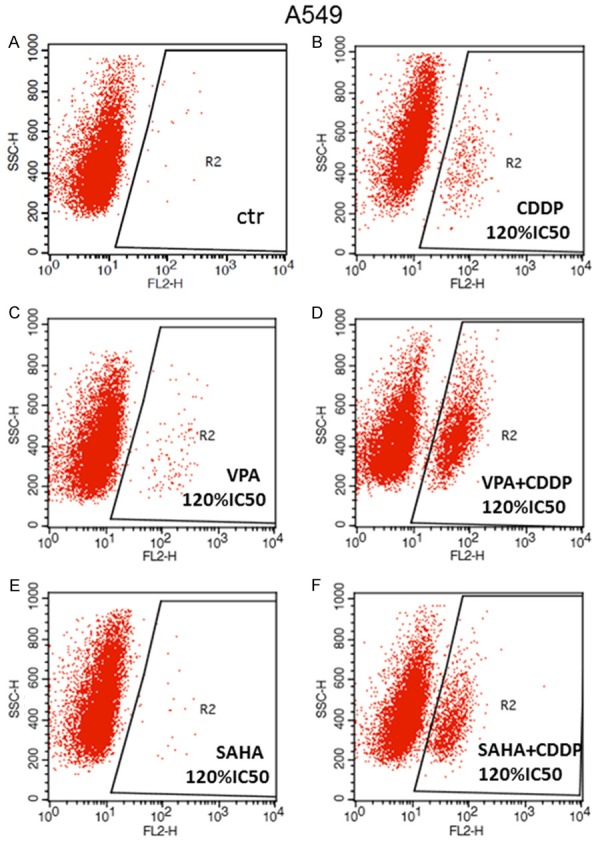
Figure 7.

A-F. Detection of apoptotic cells. Induction of apoptosis by SAHA or VPA and CDDP alone or in combinations. A549 cell line was cultivated for 48 hours with dose 2.4 = 120% IC50) of active compounds and their mixtures and analyzed by flow cytometry. Symbol R1 indicates the number of all cells, R2-cells with active caspase-3. Data was analyzed by flow cytometry.
