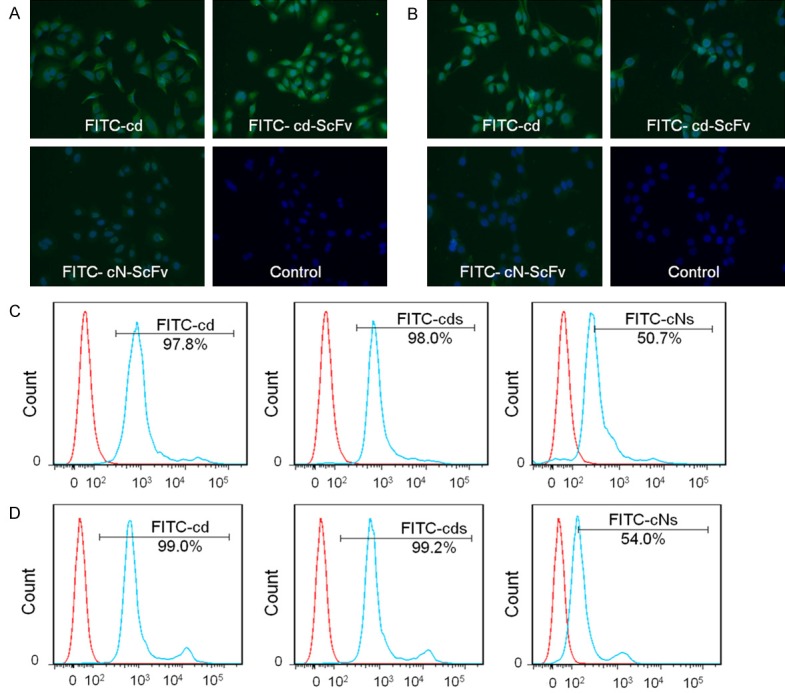
Figure 3.

Binding ability of cdGIGPQc-ScFv to lung cancer cells in vitro. Fluorescence microscope imaging was used to detect the binding of FITC-cdGIGPQc-ScFv and FITC-cNAQAEQc-ScFv to A549 cells (A) and L78 cells (B), respectively. Scale bar: 100 μm. The binding affinity of cdGIGPQc-ScFv and cNAQAEQc-ScFv to A549 (C) and L78 cells (D) was examined by flow cytometry. Histograms were generated from FlowJo software. The blue lines represented lung cancer cells treated with FITC-cdGIGPQc, FITC-cd-ScFv or FITC-cN-ScFv, while the red lines represented the negative control.
