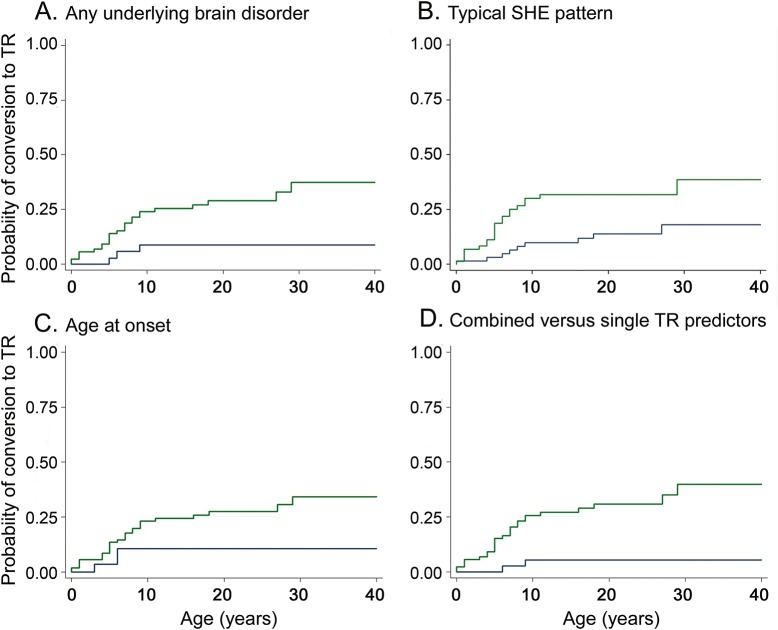
Figure 3. Terminal remission predictors.
Terminal remission (TR) as a function of (A) any underlying brain disorder (at least one of the following: intellectual disability, personal history of perinatal insult, pathologic neurologic examination, brain structural abnormalities): absence of any underlying brain disorder (green curve) and presence of any underlying brain disorder (blue curve) identified; (B) typical sleep-related hypermotor epilepsy (SHE; 100% of sleep-related events): patients with typical SHE (green curve) showed a higher TR rate than patients experiencing seizures in wakefulness (blue curve); (C) age at epilepsy onset: the cumulative probability of TR is higher in patients with age at onset ≥6 years (green curve) compared to patients with earlier epilepsy onset (blue curve); (D) combined vs single TR predictors (absence of any underlying brain disorder, typical SHE, and age at onset ≥6 years): the combination of at least 2 of the TR determinants identified (green curve) compared to having one or none of them (blue curve).

