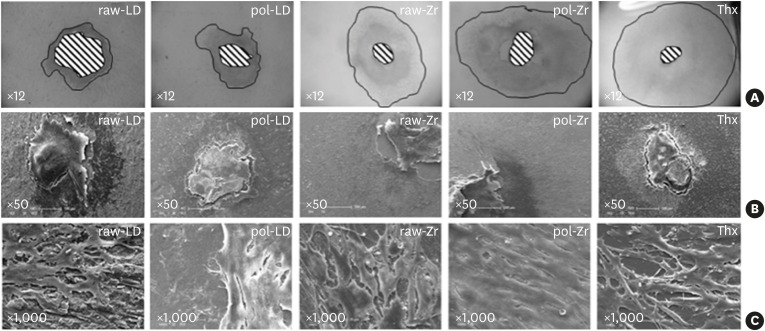
Figure 4.
Scanning results of raw-LD, pol-LD, raw-Zr, and pol-Zr compared to Thx. (A) White-light interferometry measuring the area with neutral red staining using imaging software (×12); and (B, C) scanning electron microscopy showing shapes and layers of cells (B, ×50; C, ×1,000).
raw-Zr, raw ZrO2 ceramic sample; pol-Zr, polished ZrO2 ceramic sample; raw-LD, raw LS2 ceramic sample; pol-LD, polished LS2 ceramic sample; Thx, Thermanox®.

