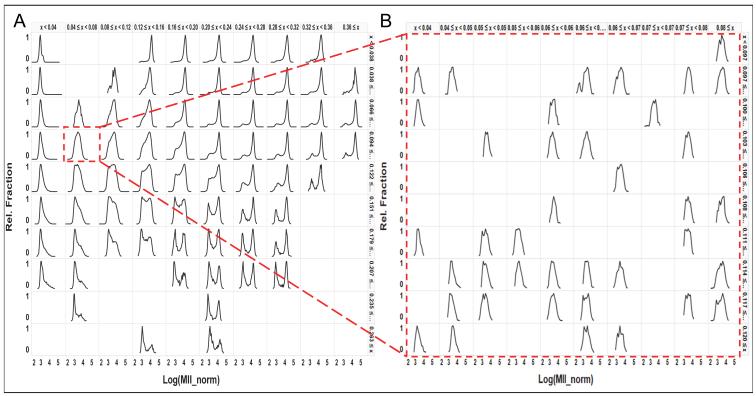
Figure 7.
Filtering and drilling into 22,000 distributions using the Heterogeneity Indices. A. The QE and KS-norm indices were binned into 10 uniformly sized bins, and then used to sort the cell distributions in the horizontal and vertical directions, respectively. This provides an overview of the general distribution shapes. Each distribution in this view is composed of all the cells from all the wells for which the QE and KS-norm indices fell within that bin. B. Selecting a single bin to zoom in to the distributions that comprise that bin, but are now displayed with finer resolution on the binning for more detailed review of the distributions within that subset of wells.

