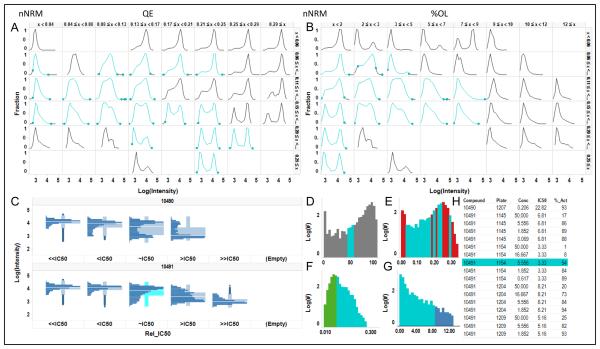
Figure 8.
Heterogeneity Browser for High Throughput Cytometry. The filtering concept in Figure 7 was expanded into an interactive Heterogeneity Browser in which the cellular heterogeneity in the wells can be identified and reviewed in a variety of ways. All data in the browser is linked, so that selection of data in one graph highlights the data in all other graphs. Here, the distributions with %Activation=45-55% have been selected in D, and are highlighted in cyan in all the views. A. 2D matrix of distributions with increasing QE index on the horizontal axis and increasing normality (decreasing nNRM) on the vertical axis. B. 2D matrix with increasing % OL on the horizontal axis and again decreasing nNRM on the vertical axis. C. The dose-response of distributions for a two compounds. The interface allows scrolling through all the compounds in the selection. D-G. Histograms of the percent activated cells and the 3 HIs for the pooled replicate wells over the whole data set. D. % activated cells. E. QE index. F. nNRM index. G. %OL index. H. List of all compounds highlighting one in the current selection.

