Fig. 5.
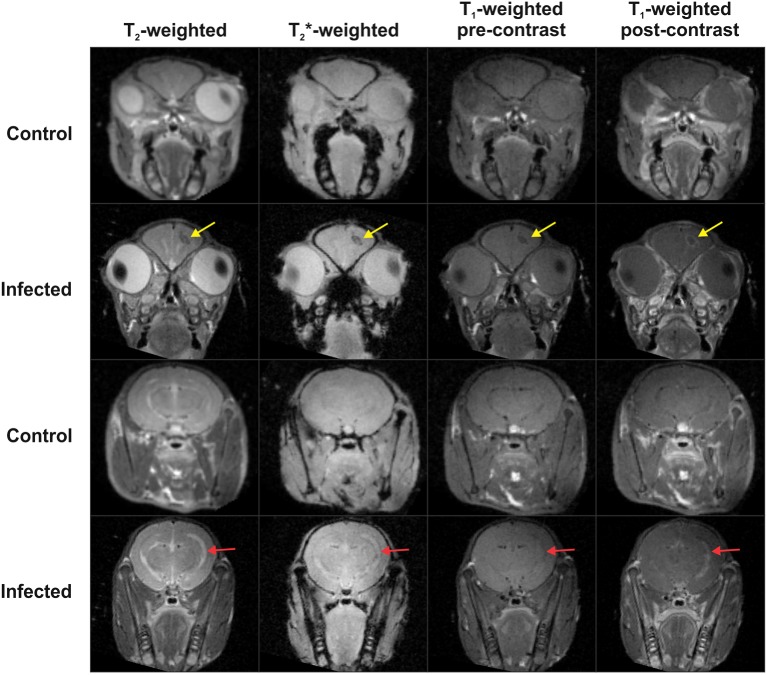
MR imaging demonstrates gadolinium enhancement of TB lesions. Representative coronal MR images of 1 mm thick slices of control and M. tuberculosis-infected animals at the site of injection (rows 1 and 2) and posterior to site of injection (rows 3 and 4) at 28 days post-infection. Control animal in first and third row demonstrates normal MRI with T2-, T2*-, pre- and post-contrast T1- weighted images. Row 2 shows hypodense TB lesion in right hemisphere with post-contrast T1-weighted enhancement of the lesion (yellow arrow) in the M. tuberculosis-infected animal. Row 4 demonstrates enlarged ventricle in the T2-weighted image with visible post-contrast enhancement in the T1-weighted image (red arrow) in the M. tuberculosis-infected animal.

