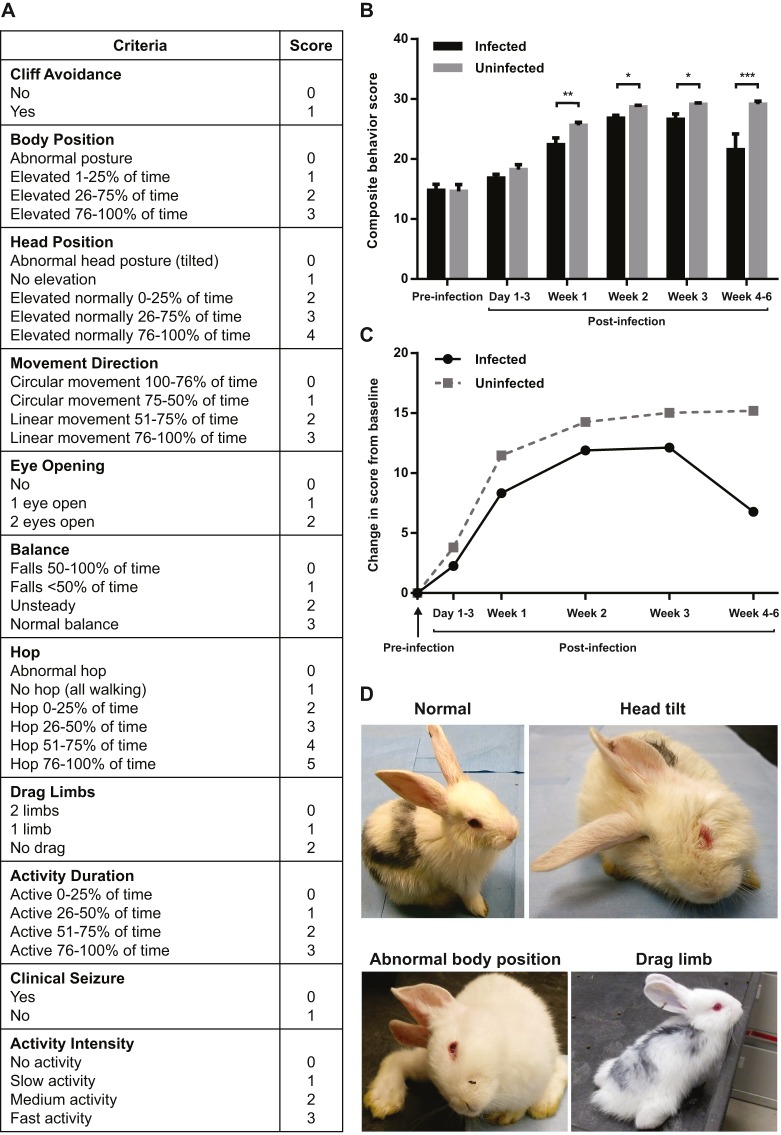
Fig. 6.
Neurobehavioral testing shows decreased maturity and loss of function/motor deficits in M. tuberculosis-infected animals. (A) Composite behavior score criteria. Lower scores reflect decreased maturity and/or loss of function/motor deficits. (B) Composite behavior scores were significantly lower in M. tuberculosis-infected animals at 1 week (M. tuberculosis-infected 22.38±1.14, n=20; control 25.61±0.52, n=14; P=0.01), 2 weeks (M. tuberculosis-infected 26.82±0.47, n=28; control 28.69±0.26, n=18; P=0.03), 3 weeks (M. tuberculosis-infected 26.63±0.88, n=20; control 29.11±0.24, n=14; P=0.02) and 4-6 weeks (M. tuberculosis-infected 21.55±2.63, n=7; control 29.17±0.5, n=4; P<0.01) post-infection compared with controls. *P<0.05; **P≤0.01; ***P≤0.001. Composite behavior scores are presented as mean±s.e.m. and statistical analysis was done by linear mixed models. (C) Maturation assessment comparing change in composite behavior score from baseline over time. This graph of the change in behavior from baseline at each time point demonstrates the delayed rate of achievement of milestones in the M. tuberculosis-infected animals and subsequent loss of function when compared with controls. The level of maturation achieved by control animals at postnatal age of ∼14 days (corresponds to 1 week post-infection) was seen only at 3 weeks of age (2 weeks post-infection), in the M. tuberculosis-infected animals. (D) Left, upper picture is a control animal with normal head position and motor control of limbs. Right, upper picture is M. tuberculosis-infected animal with head tilt to right. Left, lower picture is M. tuberculosis-infected animal with head tilted to right, inability to hop, and abnormal body position. Right, lower picture is a M. tuberculosis-infected animal with limb dragging.

