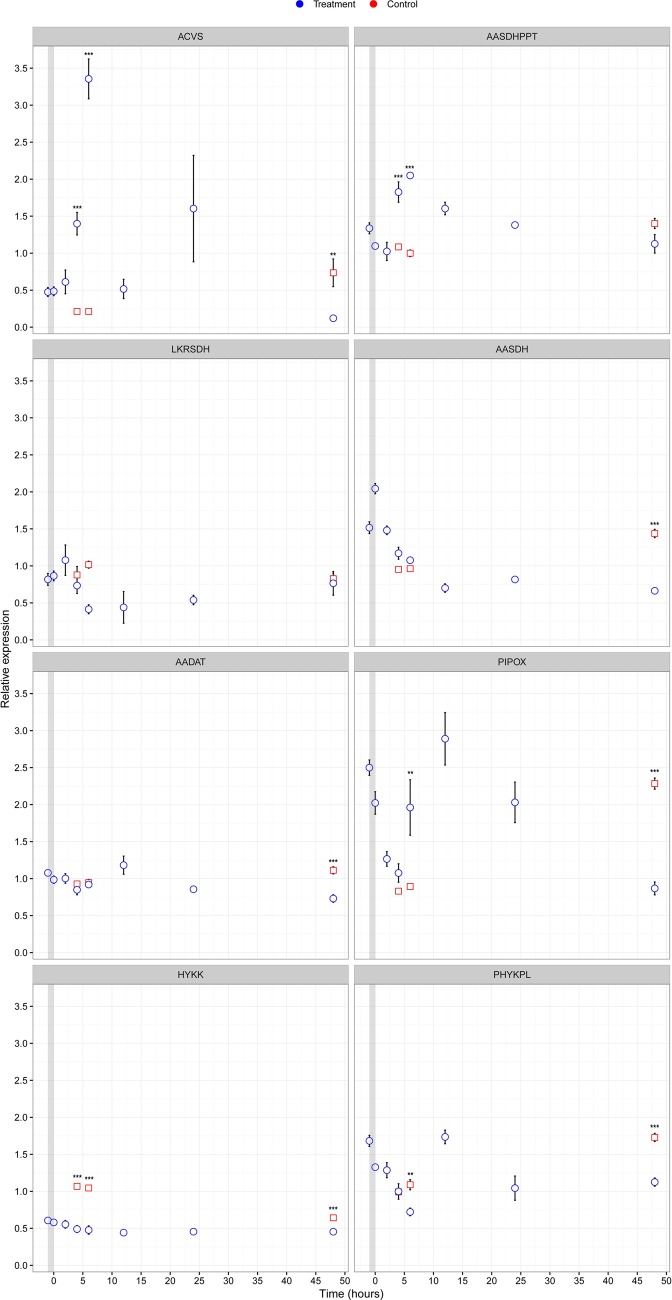
Fig. 2.
Relative expression of supporting pathways for beta-lactam biosynthesis in F. candida after heat shock. Gene expressions were determined from qPCR-derived cycle threshold values for cDNA amplification relative to two reference genes. Points depict observed means for each sampling time (n=4) and error bars depict the standard error of the means as a function of time. Blue bullets, samples that received heat shock; red squares, controls. The grey column represents the time of the heat shock. Asterisks depict significance level, (*P<0.05; **P<0.01; ***P<0.001) from the two-way ANOVA analysis in R 3.2.2.

