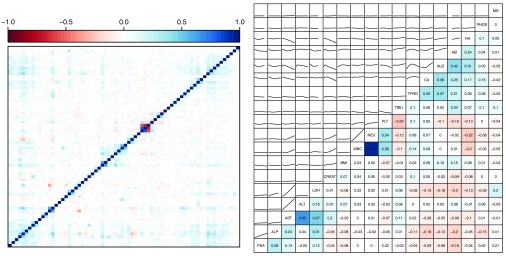
Figure 1. Correlation plot (left) for all binary predictors.
See Supplementary Figure 1 for the correlation plot with labels. Correlations (right, below the diagonal) and pairwise associations as given by loess scatter plot smoothers (right, above the diagonal) for the numerical predictors.

