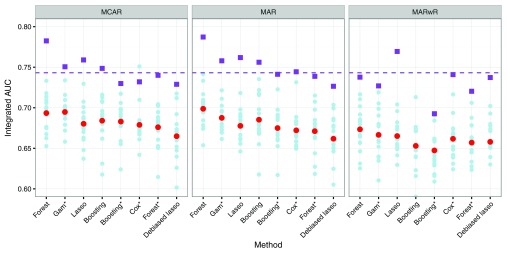
Figure 2. Integrated AUC for different combinations of methods evaluated by three replications of 5-fold cross-validation.
Results are shown for individual folds (light blue filled circles) and averaged over all folds (red filled circles). The figure also shows iAUC on the validation data (purple filled squares) and iAUC for the reference model on the validation data (purple dashed line). The four methods marked with a * used variables chosen via stability selection, whereas the other four methods relied on implicit variable selection.

