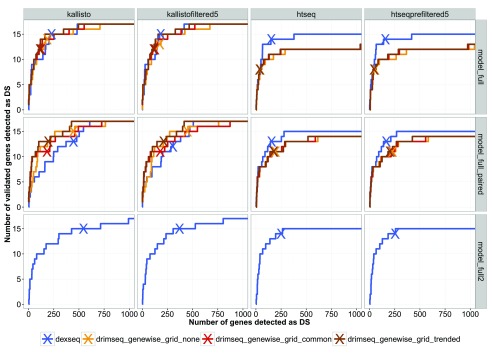
Figure 3. Results of DS analysis on the pasilla dataset showing how many of the 16 validated genes are called by DRIMSeq and DEXSeq using different counting strategies and different models.
On each curve, "X" indicates the number of DS genes detected for the FDR of 0.05. Model full - comparison of 4 control samples versus 3 knock-down. Model full paired - comparison of 2 versus 2 paired-end samples. Model full 2 - as model full but including the information about library layout (no results for DRIMSeq because currently, it is not able to fit models with multiple covariates).

