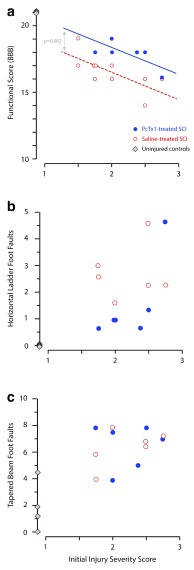
Figure 2. Effect of PcTx1 treatment on hind limb function at 6 weeks after SCI.
Locomotor functional data are plotted against the initial injury severity (SIS scores); ( a) BBB functional scores, ( b) horizontal ladder and ( c) tapered beam. Each data point represents an individual animal, PcTx1-treated (blue circles), saline-treated (red open circles) and uninjured controls (grey diamonds). Correlation lines in ( a) were fitted by least squares linear regression. The data were best described by two separate lines of the same slope, but with a statistically significant difference in elevation (p=0.002; ANCOVA).

