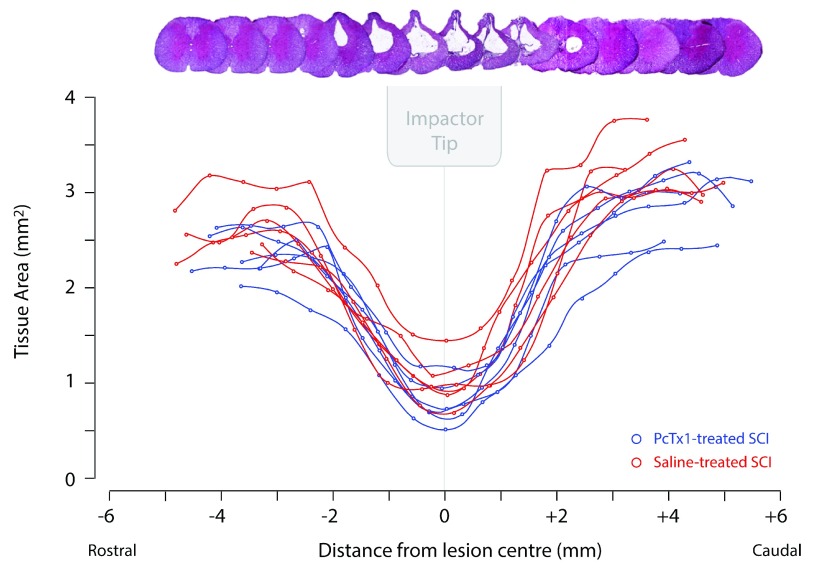
Figure 3. Cross-sectional areas of tissue in serial H&E stained transverse sections along the length of the spinal cord at 6 weeks post-injury.
Areas of preserved tissue were calculated as the total cord area minus the area of the central cystic cavity. PcTx1-treated rats (blue lines; n=6) and saline-treated rats (red lines; n=6) are shown. Negative values on the x-axis indicate regions rostral to the injury centre (0) and positive values indicate regions caudal to the injury centre. A visual reconstruction of serial H&E traverse sections corresponding to equivalent points along the graph is shown. The relative size and position of the impactor tip at the time of injury is also indicated.

