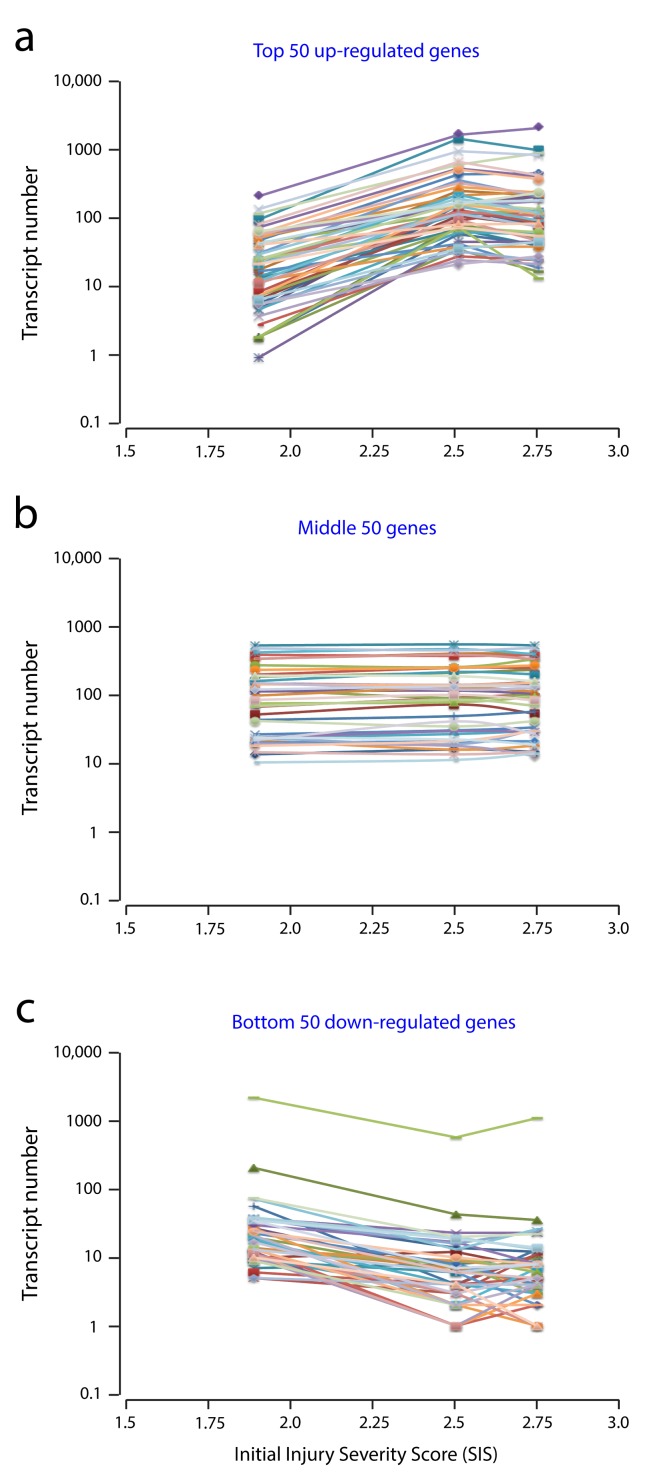
Figure 7. Correlation between raw transcript numbers and initial injury severities (SIS scores) in the rostral segment of spinal cords from PcTx1-treated rats at 24 h post-injury (Illumina Platform).
( a) shows the top 50 up-regulated genes, ( b) the middle 50 unchanged genes and ( c) the bottom 50 down-regulated genes ( Table 3). Each line represents a single gene. Data shown are for the rostral segment, similar correlations were observed in the injury and caudal segments. Note, transcript numbers increased ( a) or decreased ( c) for each gene with increasing injury severity (SIS) score. This highlights the importance of using similar size initial injuries for comparative studies.

