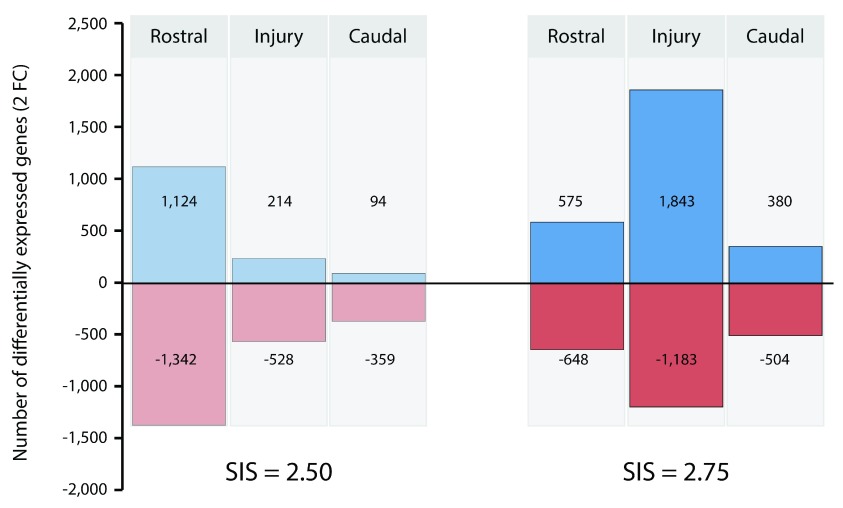
Figure 8. Comparison of the numbers of transcripts in the rostral, injury and caudal segments that changed (FC>2 or FC<-2) between PcTx1-treated and saline-treated animals.
Datasets obtained from animals with 2.5 and 2.75 SIS scores. Negative values (red) indicate the number of down-regulation genes while positive values (blue) indicate the number of up-regulated genes.

