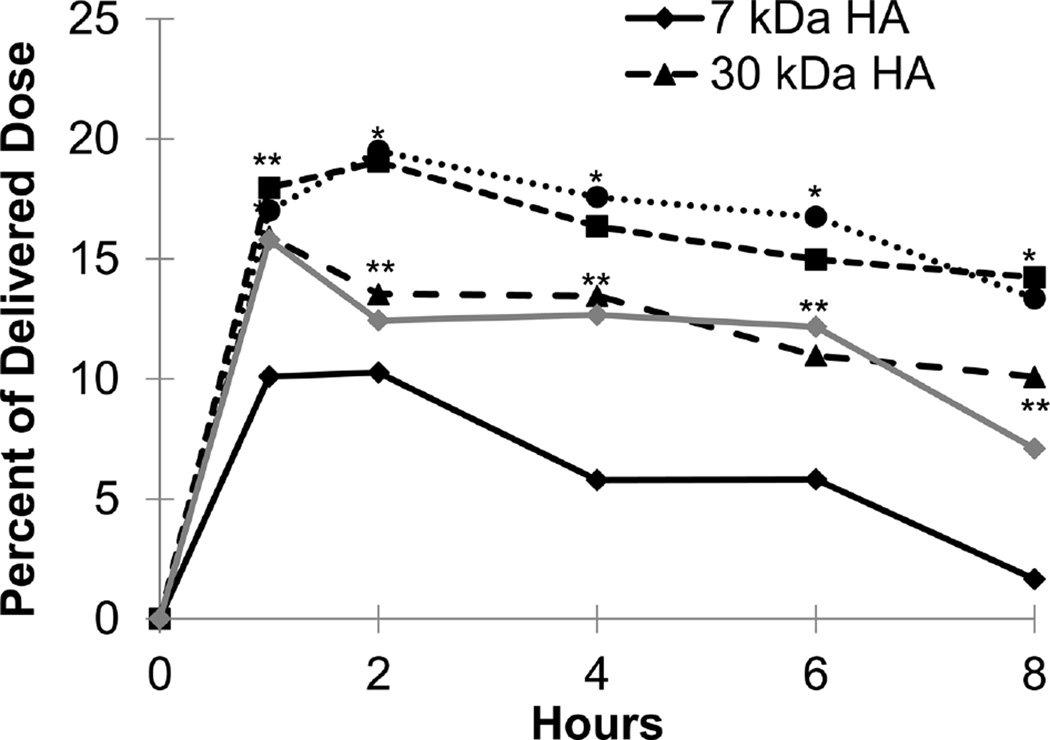
Figure 4.
Exposure levels of HA in the lungs averaged across both right and left lung lobes as a percentage of delivered dose over time for each of the five HA molecular weights. Each point is an average of at least five animals with the error on each point <5% of the measurement. * represents p value <0.05 for 67 kDa and 215 kDa HA compared with 7 kDa, 30 kDa, and 741 kDa HA. ** represents p value <0.05 for 30 kDa and 741 kDa HA compared with 7 kDa, 67 kDa, and 215 kDa HA. *** represents p value <0.05 for 30 kDa, 67 kDa, 215 kDa, and 741 kDa HA compared with 7 kDa HA.

