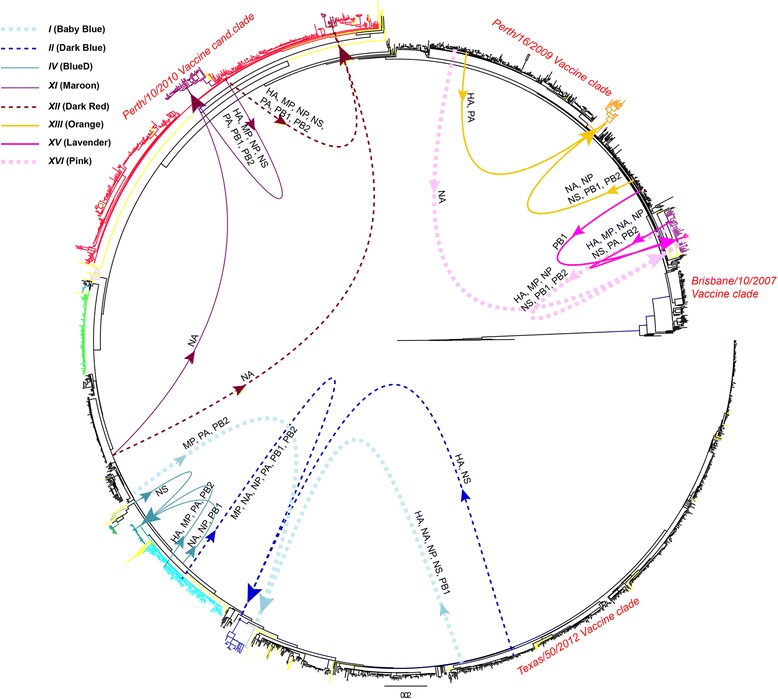
Fig. 3.

Reassortment origins and patterns of 8 reassortant lineages. Schematic figure of segment origins and patterns of intra-subtype reassortment of H3N2 reassortant lineages/clades. Each lineage represents one reassortment event. Approximate segment origins for 8 of the lineages are illustrated on a full genome maximum likelihood phylogenetic tree containing 2091 H3N2 genomes sampled between 2008 and 2014. Single unique reassortants are colored yellow in the tree. Origins and patterns were determined from ML and GiRaF analyses
