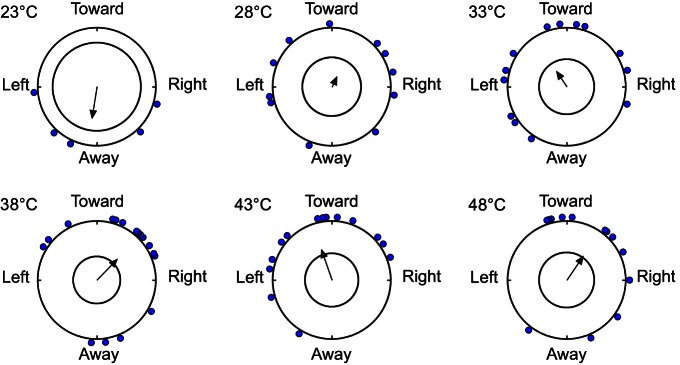
Fig. 4.
Bed bug orientation angles to heated or cooled targets. Mean orientation angle for each HH strain bed bug that responded within 5 min is displayed on the circumference of the circle representing the arena, with the grand mean of all bed bugs that responded indicated by the arrow. The interior circle at each temperature represents the respective α<0.05 (Rayleigh test), and significant deviation from random orientation is indicated by arrows that cross the interior circle (P<0.05).

