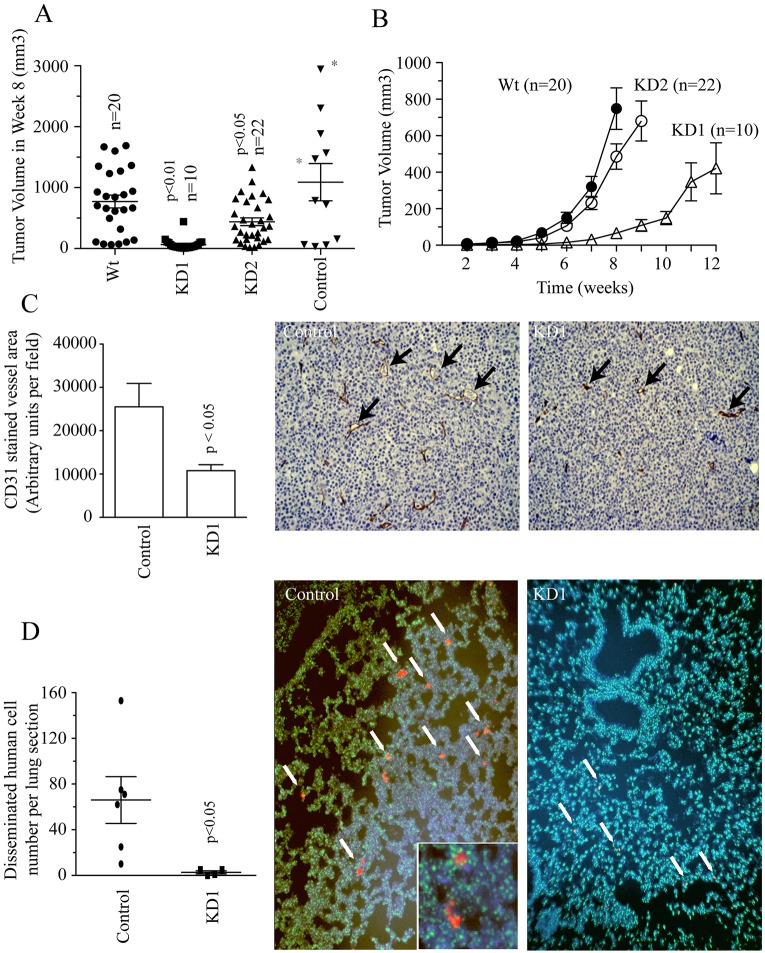
Fig. 3.
Rab40b knockdown affects vasculogenesis, primary tumor growth and metastasis in vivo. (A) Wild-type MDA-MB-231 (Wt), shRNA control (control) and Rab40b knockdown (KD1 or KD2) cells were injected in the mammary fat pad of hairless SCID mice. Mice were killed and tumor volumes were measured 8 weeks after injection. 10–25 mice per cell line type were analyzed. Asterisks (*) mark the mice that had to be killed at week 7 due to tumor sizes exceeding guidelines and ulceration. Data shown are the mean±s.d. n is the total number of tumors measured. (B) Wild-type (Wt) and Rab40b KD (KD1 or KD2) cells were implanted in the mammary fat pads of hairless SCID mice. 10–25 mice per cell line type were analyzed. Tumor volumes were measured every week and allowed to grow to a final tumor burden of 2 cm3. Data shown are mean±s.d. n is the total number of tumors analyzed. (C) Tumors isolated 8 weeks after injection from control (wild type) and Rab40b KD1 mice were analyzed through immunohistochemistry. Vessel area was examined by staining tumor samples with anti-CD31 antibodies. 15 random chosen fields in three separate sections were analyzed for each tumor. Data shown are the mean±s.d. derived from three different control and three different KD1 tumors. Arrows in images point to individual CD31-positive vessels. Note the difference in size between vessels in control and KD1 primary tumors. (D) Lungs isolated 8 weeks after injection from control and KD1 mice were analyzed by a dual-color FISH assay. Three lungs were analyzed per each tumor group. 15 randomly chosen fields from five separate sections from every lung were analyzed. The scatterplot shows the average number of metastases in each section per lung, and the mean±s.d. is indicated. Metastatic lesions consisting of human cells are indicated as red clumps and marked with white arrows in a sea of green mouse cells and blue DAPI stain. Each image is representative of the entire tumor group. P-values given are compared to control and calculated with a two-tailed Student's t-test.

