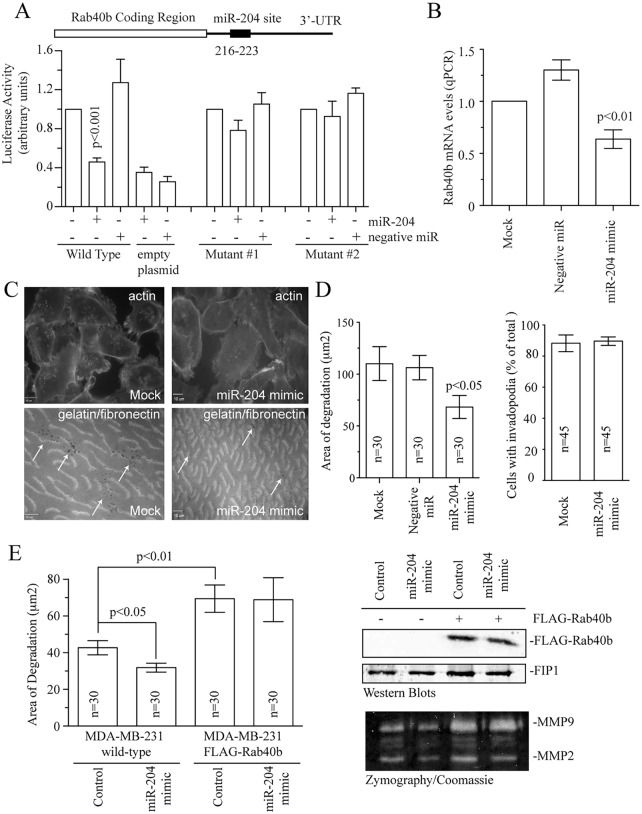
Fig. 5.
miR-204 regulates Rab40b levels in breast cancer cells. (A) The Rab40b-3′UTR contains a single putative miR-204 seed region. Wild-type and mutated Rab40b-3′UTRs were cloned into psiCheck2 dual luciferase reporter vector and cells were co-transfected with miR-204 mimic or negative control. Empty psiCheck2 plasmid was also used as a negative control. The activities of Renilla and firefly luciferase were analyzed 24 h after transfection. The data represent the percentage change in the ratio of Renilla:firefly activities compared with the controls. Data shown are the mean±s.d. from three independent experiments. Details of the two mutants is given in Fig. S4D. (B) Cells were mock-treated (without mimic) or treated with negative control or 50 nM of miR-204 mimic for 72 h. Cells were then harvested and levels of Rab40b mRNA analyzed by qPCR. Data shown are the mean±s.d. from 3 independent experiments. (C,D) Untreated MDA-MB-231 cells (control or mock) MDA-MB-231 cells treated with negative control or miR-204 mimic were plated on coverslips coated with gelatin supplemented with HiLyte-Fluor-488-labeled fibronectin. After 72 h of incubation, cells were fixed and stained with Rhodamine–phalloidin. Dark spots mark the sites of invadopodia-dependent ECM degradation (arrows). Top (actin) and bottom (gelatin with fibronectin) images for control and miR-204 mimic are of the same optical field. Data shown on bar graph (D) are the mean±s.d. from three independent experiments. n is the total number of individual cells analyzed. (E) Quantification of ECM degradation and MMP2 and MMP9 secretion in wild-type or FLAG–Rab40b-expressing MDA-MB-231 cells treated with miR-204 mimic and negative control. Data shown are the mean±s.e.m. of three independent experiments. n is the total number of cells analyzed for every treatment. The western blot shows the FLAG–Rab40b expression levels. FIP1 is used as loading control. The bottom gel shows the effects of miR-204 treatment and FLAG–Rab40b overexpression on secretion of MMP2 and MMP9 as measured by zymography assays. P-values given were compared to control and calculated with a two-tailed Student's t-test.

