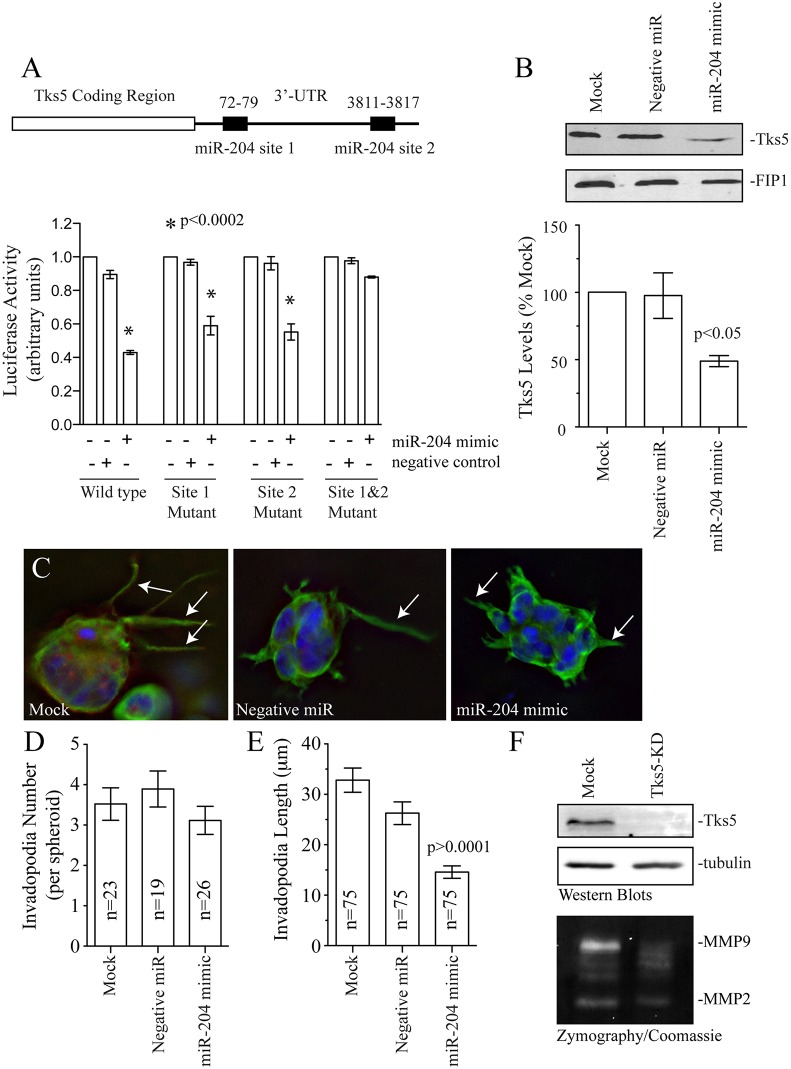
Fig. 6.
miR-204 regulates Tks5 levels in breast cancer cells. (A) The Tks5-3′UTR contains two putative miR-204 seed regions. 3′UTR fragments containing both the miR-204 seed regions were cloned adjacent to each other into psiCheck2 dual luciferase reporter vector and co-transfected with miR-204 mimic or negative control into cells. Data shown are the mean±s.d. from three independent experiments. (B) Western blot of MDA-MB-231 cells treated with miR-204 mimic or negative control, were probed with anti-Tks5 antibody. FIP1 is used as a loading control. The bar graph shows levels of Tks5 as a percentage of mock (untreated). Data shown are the mean±s.d. of three independent experiments. (C–E) MDA-MB-231 cells treated with miR-204 mimic or negative control miR, were embedded in a Matrigel+collagen I mixture and incubated for 4 days. The spheroids were then fixed and stained with anti-tubulin antibody to quantify the number and length of invadopodia (arrows). Data shown are the mean±s.d. of three independent experiments. n is the total number of spheroids analyzed. (F) The effect of Tks5 knockdown (Tks5-KD) on MMP2 and MMP9 secretion. The western blots show the extent of Tks5 knockdown. Tubulin is used as loading control. The bottom gel shows the effect of Tks5 depletion on secretion of MMP2 and MMP9 as measured by zymography assays.

