Fig. 2.
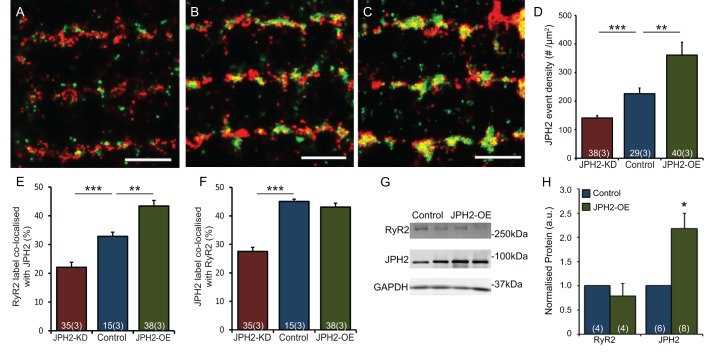
JPH2 expression influences colocalisation with RyR. Super resolution images showing dual immunolabelling of RyR (red) with JPH2 (green) in cardiomyocytes isolated from (A) JPH2-KD, (B) control and (C) JPH2-OE mice. Scale bars: 1.5 µm. (D) Global mean density per cell cross-sectional area of JPH2 localisation events in the three genotypes. JPH2-KD, n=38 cells, 3 animals; control, n=29 cells, 3 animals; JPH2-OE, n=40 cells, 3 animals. (E,F) Colocalisation analysis in JPH2-KD (red), control (blue) and JPH2-OE (green) mice showing the fraction of (E) RyR label colocalised with JPH2 and (F) JPH2 label colocalised with RyR; JPH2-KD: n=35 cells, 3 animals, control: n=15 cells, 3 animals, JPH2-OE: n=38 cells, 3 animals. (G) Western blot analysis of RyR, JPH2 and GAPDH expression levels in control and JPH2-OE mice with (H) GAPDH-normalised expression levels of RyR and JPH2 in control (blue) and JPH2-OE (green) mouse hearts; RyR, n=5 animals each; JPH2, n=5 control animals, n=6 JPH2-OE animals. Data are displayed as mean±s.e.m. *P<0.05, **P<0.01, ***P<0.001 (Kruskal–Wallis two-sided test in D; two-sided Student's t-test in E,F,H).

