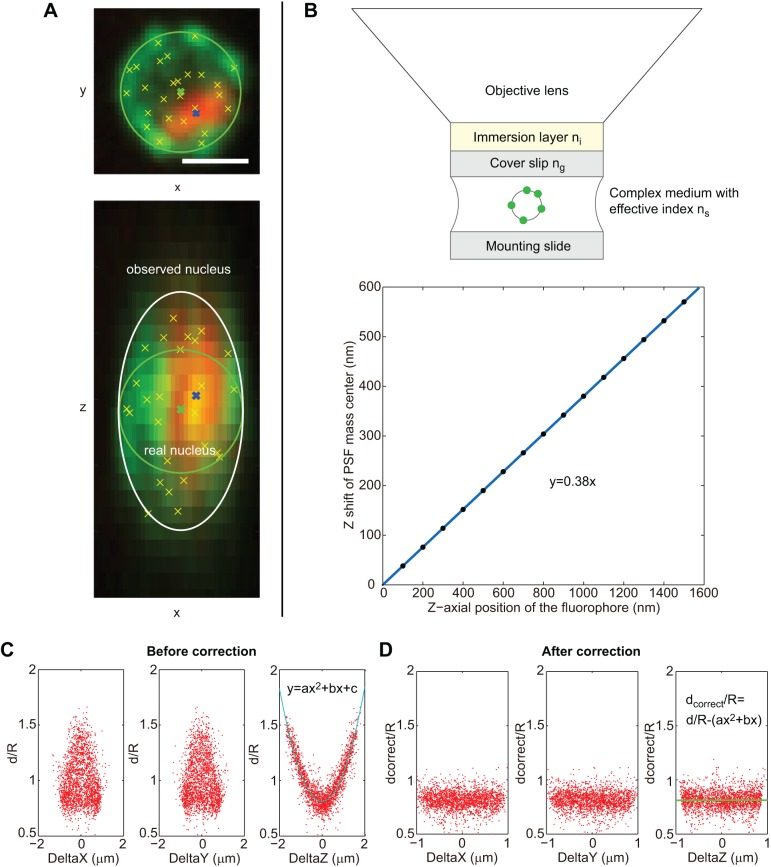
Fig. 1.
Detection and correction of the aberrations along the z axis. (A) Yeast nucleus in exponential phase with nuclear pores labeled in green and the nucleolus in red (maximum intensity projections of a 3D image stack in x–y plane and x–z plane). Yellow crosses show detected NPCs, green crosses show the nucleus center, blue crosses show nucleolus centroid. Green circles show the expected edge of the nucleus and white ellipse shows the detected edge. Strain yCNOD99-1a. Scale bar: 1 μm. (B) Immersion layer refractive index=1.51, cover slip 170 μm and refractive index=1.51, sample refractive index=1.38. Objective lens: NA=1.4×100, lambda=520 nm. Linear z-level shift of PSF mass center and the real z-axial position of the fluorophore. (C) The normalized distance distribution of the detected NPCs to the nuclear center along x-level, y-level and z-level before correction of the aberration along z axis. d, distance of NPCs to the nuclear center; R, radius of each nucleus. Strain yCNOD99-1a, a=0.26, b=0.0029, c=0.81. (D) The normalized distance distribution along x-level, y-level and z-level after correction of the aberration along z axis. dcorrect=corrected distances of NPCs to the nuclear center.

