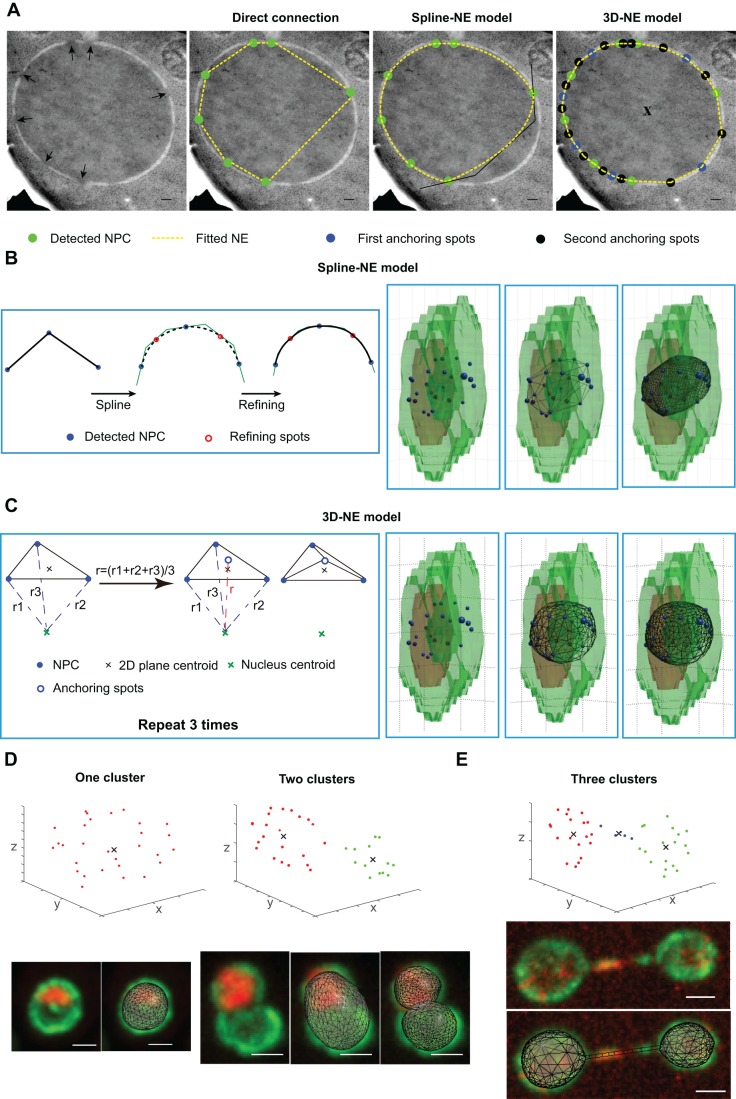
Fig. 3.
Extrapolation of nuclear envelope using detected NPCs. (A) 2D models building nuclear envelopes are represented onto electron microscopic micrographs of nuclear sections on which the positions of NPCs are visually detected (black arrows in the left panel). Strain BY4741. In the second image, the nuclear envelope is built by connecting adjacent NPCs. In the third image, the nuclear envelope is built by spline interpolation. In the right panel, the nuclear envelope is fitted by generating anchoring spots in nuclear envelope. Scale bars: 100 nm. (B,C) Based on the 3D confocal microscopic images, we could detect the NPC positions (blue spheres). Strain yCNOD99-1a. Using the spline-NE model (B), we refined the connection to get a smooth nuclear envelope. Red circles represent the spots that were used to refine the connection. 3D-NE model (C) generates additional anchoring spots (blue empty circle) to get an accurate extrapolation of the nuclear envelope. (D) The fitted nuclear envelope based on 3D-NE model for the nuclei characterized by one (left) or two (right) NPCs clusters. Upper graphs: x, y, z coordinates of detected NPCs; black cross, centroid of detected cluster(s); cluster 1 in red, cluster 2 in green. Strain yCNOD99-1a. (E) The fitted nuclear envelope based on 3D-NE model for the anaphase nuclei characterized using three NPCs clusters. Cluster 3 in blue. Strain yCNOD203-1a. Scale bars in D,E: 1 µm.

