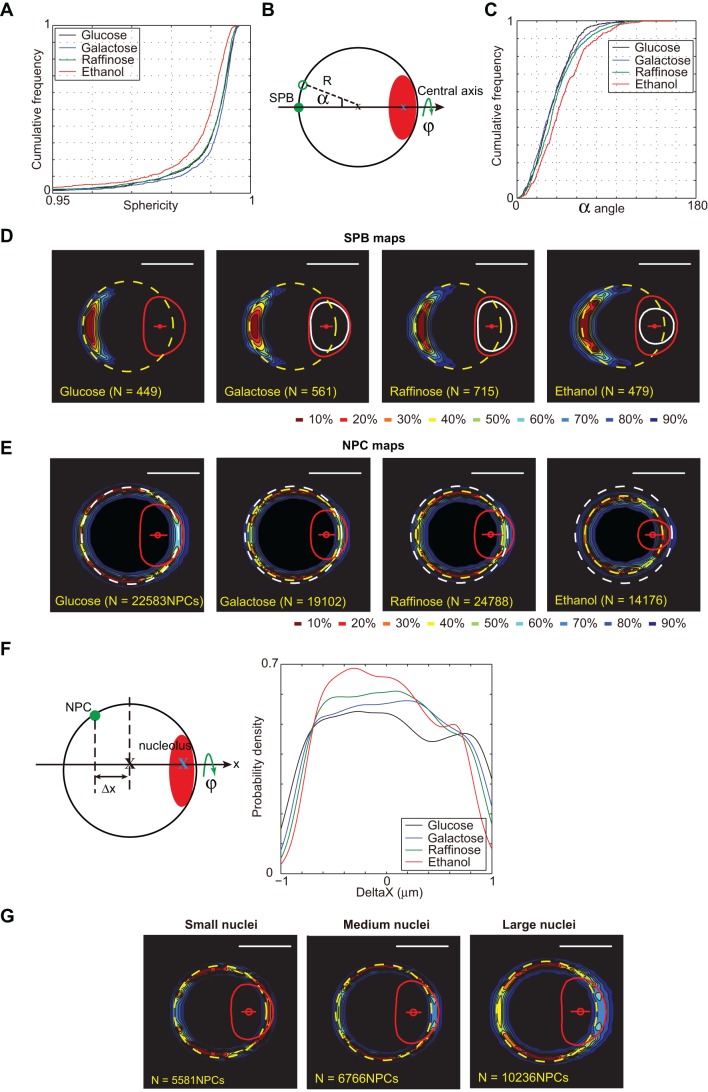
Fig. 5.
The nuclear geometry according to the carbon sources. (A) Cumulative distribution of sphericity of the interphase nuclei cultured in different carbon sources. Strain yCNOD99-1a. (B) Cylindrical coordinates system with an oriented axis in which the position of the SPB is described by its distance from the nuclear center (R) and the angle from the central axis (α). Nucleolus is displayed in red. Angle φ represent rotation around central axis. (C) Cumulative frequency of the angle α between SPB and the central axis. Strain yRW11-1a. (D) SPB probability density maps based on analysis of nuclei comparing glucose with different carbon sources containing media. In glucose: dashed yellow circle, nuclear envelope determined according to the 3D-NE method; red curve, median nucleolus; red dot, median nucleolar centroid. Compare nucleolar size in glucose (red) with nucleolar size in other carbons sources (white). N represents the number of nuclei used to generate the cumulative percentage maps. (E) NPCs probability density maps based on analysis of nuclei in exponential phase cells growing in different carbon sources. Strain yCNOD99-1a. Compare median nuclear size in glucose (white dashed circle) with other carbon sources (yellow dashed circles). N represents the number of cNPCs used to generate the cumulative percentage maps. (F) Plotted variation of NPC density along the central axis in response to different carbon sources. (G) Heterogeneity of NPC distribution in interphasic cells. Nuclei were sorted according to their size (1/3 small, 1/3 medium, 1/3 large nuclei. Strain yCNOD99-1a. Scale bars: 1 μm.

