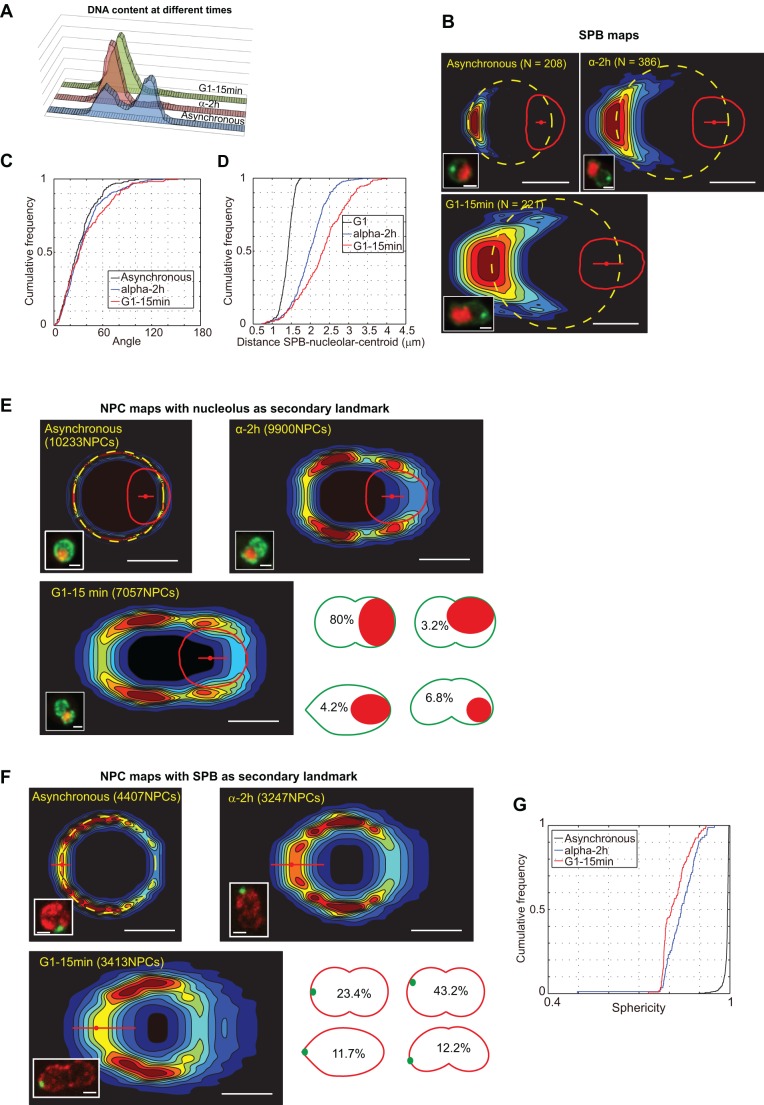
Fig. 8.
Modification of the nuclear envelope after treatment with alpha factor. (A) DNA content in asynchronous culture after 2 h of alpha factor treatment and after alpha factor removal determined by flow cytometry. Strain yCNOD99-1a. (B) SPB probability density maps before and after treatment with alpha factor using the nucleolus as a secondary landmark. Representative fluorescent pictures (GFP–Nup49, SPC42–GFP and mCherry–Nop1) are displayed. Strain yRW11-1a. (C) Cumulative frequency of the SPB–central-axis angle. (D) Cumulative frequency of the distances from the SPB to the nucleolar centroid. (E) NPC probability density maps in an asynchronous population (left map), after 2 h of alpha factor blocking (right map) and 15 min after release in G1 (bottom map), using the nucleolus as a secondary landmark. Representative fluorescent pictures (GFP–Nup49 and mCherry–Nop1) are displayed. Strain yCNOD99-1a. Drawings depict the different nuclear shapes and the position and size of the nucleolus after 2 h treatment with alpha factor. (F) NPC probability density maps before and after treatment with alpha factor using the SPB as a secondary landmark. Representative fluorescent pictures (SPC42–GFP and Nup57–tDimerRFP) are displayed. Strain yRW10-1a. Drawings depict the percentage of different nuclear geometries after 2 h treatment with alpha factor. (G) Cumulative distribution of sphericity after 2 h of alpha factor blocking and 15 min after release in G1. Scale bars: 1 μm.

