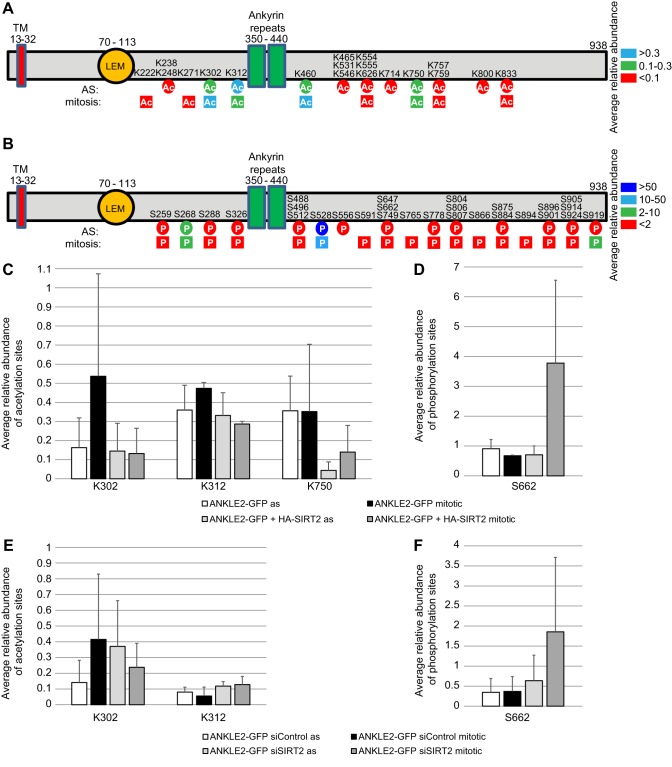
Fig. 4.
SIRT2 regulates ANKLE2 acetylation and phosphorylation dynamics in vivo. (A,B) ANKLE2–GFP (A) acetylation and (B) phosphorylation sites identified in asynchronous (circles) and mitotic (square) cells in three independent experiments. Acetylated lysine and phosphorylated serine residues are coloured according to their average abundance relative to unmodified peptides. (C–F) Changes in the relative abundance of (C,E) ANKLE2 acetylation sites and (D,F) a phosphorylation site upon SIRT2 overexpression (C,D) or silencing (E,F). Mean±s.e.m. values from two to four independent experiments are shown. The acetylation sites shown are characterized by a >0.1 relative abundance and a reproducible reduction in acetylation upon SIRT2 overexpression or increase in acetylation upon SIRT2 silencing. The phosphorylation site fulfils the criteria of a >1 relative abundance and a reproducible increase in mitotic phosphorylation. Relative abundance ratios show considerable variability due to inherent limitations of the shotgun mass spectrometry analysis of substoichiometric modifications.

