Fig. 2.
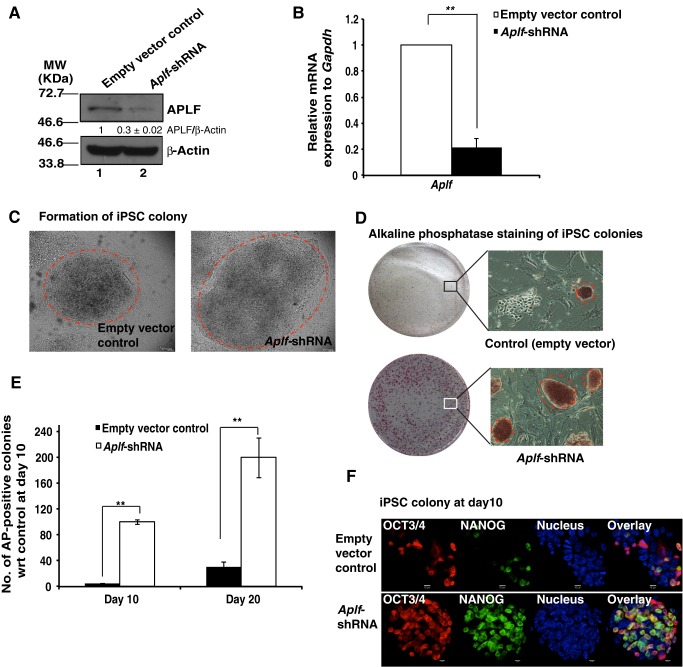
Downregulation of APLF enhances reprogramming of fibroblasts. (A) MEFs were transduced with lentiviral particles expressing shRNA against Aplf (Aplf-shRNA) or empty plko.1 vector (empty vector control). Extent of knockdown was measured at the (A) protein and (B) mRNA level. The band intensity of blots was measured by using ImageJ software. The relative intensity of APLF to β-actin immunoreactive bands was determined, and the value for the control was normalized to 1. The intensity is the average of three independent experiments. (C) Control (with empty plko.1 vector) and Aplf-kd (expressing Aplf-shRNA) MEFs were transduced with polycistronic vector expressing OSKM under the influence of the Tet operator. Doxycycline (2 µg/ml) induced the expression of OSKM. Micrographs show iPSC colonies generated from control (left panel) and Aplf-kd MEFs (right panel). Dashed circles mark iPSC colonies. (D) Alkaline phosphatase staining of iPSC clones in control (upper panel) and Aplf-kd (lower panel) cells. Micrographs of the alkaline-phosphatase-positive clones at 10× magnification are also included. Dashed circles indicate pluripotent iPSC colonies. Similar colonies only were counted as alkaline-phosphatase-positive clones. (E) Bar graph demonstrating the number of alkaline-phosphatase-positive clones formed at day 10 and day 20 of reprogramming from control and Aplf-kd cells with respect to control set at day 10. (F) Immunofluorescence study of the expression of NANOG and OCT3/4 in control and Aplf-kd cells at day 10 of reprogramming. Error bars are s.e.m., n=3, **P<0.01 (Student's t-test).

