Fig. 6.
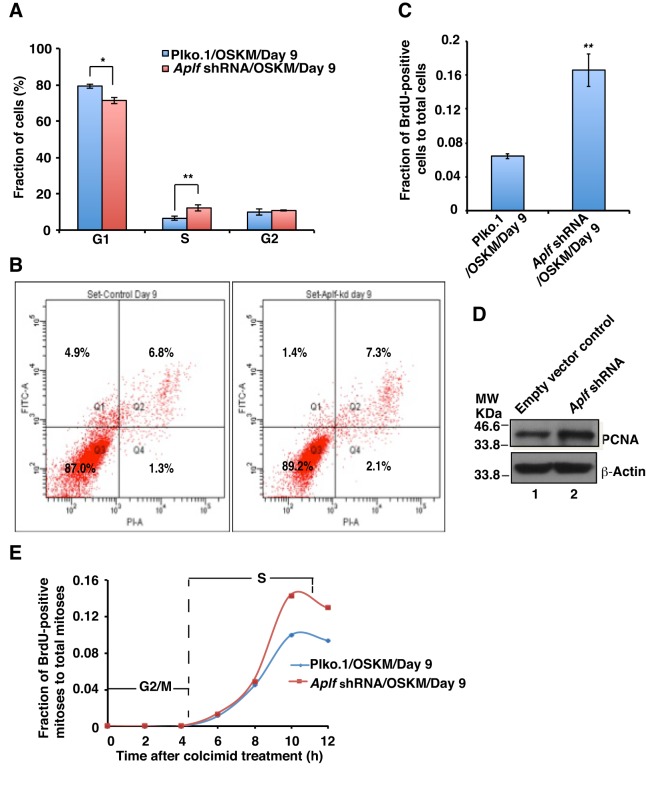
Aplf downregulation does not induce cellular arrest. (A) Cell cycle analysis. Control and Aplf-kd cells at day 9 were stained with propidium iodide and analyzed using flow cytometry. (B) Apoptosis assay. Control (left panel) and Aplf-kd (right panel) cells at day 9 were stained with Annexin-V–FITC and propidium iodide, followed by FACS analysis. Q1 represents FITC-labeled early apoptotic cells. (C) BrdU incorporation into control and Aplf-kd cells during reprogramming. Cells were pulsed with BrdU and analyzed for BrdU and Hoechst 33258 staining by immunofluorescence analysis. BrdU-positive nuclei were counted and expressed as the fraction of total nuclei present. ∼1000 cells were counted for each set. (D) The same set of cells as described in A,B were analyzed for the expression of PCNA by western blotting. (E) Determination of cell cycle phase length. Control and Aplf-kd cells were treated with BrdU in a similar manner as described in C and treated with colcemid (100 ng/ml) for 12 h in ESC culture medium. At each interval of 2 h, cells were fixed to analyze the BrdU staining and observed using fluorescence microscopy to enumerate the BrdU-positive mitoses. Plot represents the fraction of cells undergoing BrdU-positive mitoses (of the total mitoses) over time. For each time point, 30–40 mitoses were analyzed. Error bars are s.e.m., n=3, *P<0.05, **P<0.01 (Student's t-test).

