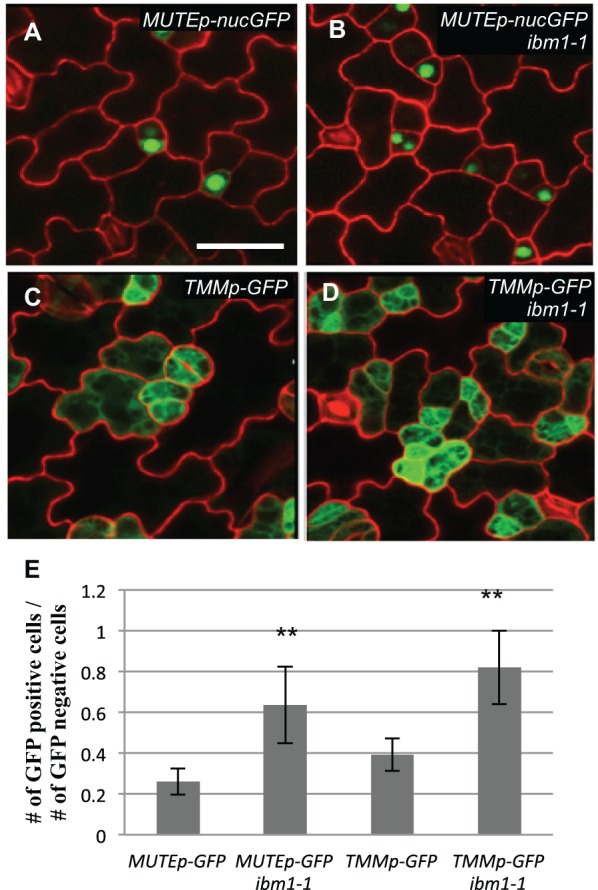
Fig. 2.

Overproduction of stomatal lineage cells in ibm1 mutants. (A-D) Confocal images of 3-dpg adaxial cotyledons expressing cell identity markers (green). Cell outlines are stained with FM4-64 (red). Scale bar: 30 μm (in A, for A-D). (A,B) The meristemoid marker MUTEp-nucGFP (nuclear GFP) in Col (A) and ibm1-1(B). (C,D) The stomatal lineage marker TMMp-GFP in Col (C) and ibm1-1 (D). More cells expressing GFP were evident in ibm1-1 mutants. (E) Histogram showing the ratio of the number of GFP-positive cells over that of GFP negative. *P<0.05, **P<0.01; Student's t-test with Bonferroni correction (n=6; ±s.d.) was used to compare the marker lines in ibm1-1 with the wild type.
