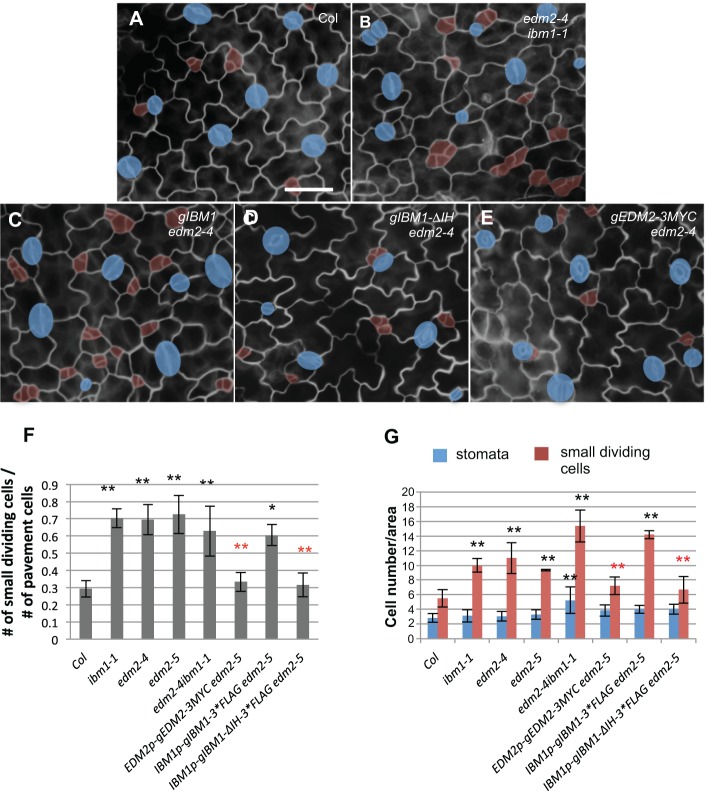
Fig. 3.
Stomata defects in edm2 are caused by impaired expression of IBM1. (A-E) Epi-fluorescence images of 3-dpg adaxial cotyledons of Col (A), edm2-4 ibm1-1 (B), IBM1-gDNA in edm2-4 (C; full-length genomic IBM1), gIBM1-ΔIH in edm2-4 (D; the intron region deleted from gIBM1) and EDM2-gDNA-3*Myc in edm2-4 (E; full-length genomic EDM2). The control image (A) is also shown in Fig. 6A because these experiments were performed concurrently. The double mutant edm2-4 ibm1-1 produced more stomatal lineage cells. The full-length IBM1 failed to rescue edm2, but the intron-minus version did. Blue shades indicate stomata, and small dividing cells are highlighted by red. Scale bar: 30 μm (in A, for A-E). (F) Histogram showing the ratio of the total number of small dividing cells relative to that of the pavement cells in different genotypes. The double mutant edm2-4 ibm1-1 resembles the single mutants of ibm1-1 and edm2-4. Successful complementation was found by EDM2 transgene, as well as truncated IBM1 transgene (ΔIH), but not by the full-length IBM1. *P<0.05, **P<0.01; Student's t-test with Bonferroni correction. Black asterisks indicate significantly different from Col and red asterisks indicate significantly different from edm2-5. (G) Quantification of the total number of stomata and small dividing cells in the indicated mutants. The same format of statistical analysis is used as in F.

