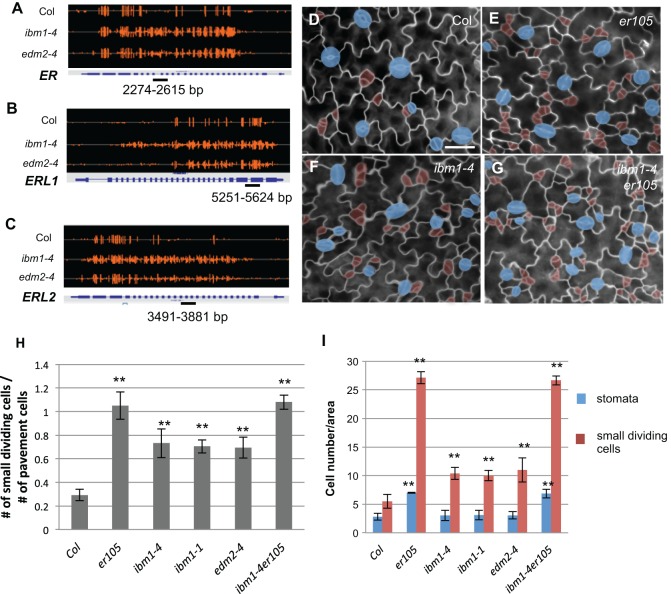
Fig. 4.
ER genes are hypermethylated in ibm1 and edm2 mutants. (A-C) Integrated genome viewer snapshots showing the DNA methylation status of ER (A), ERL1 (B) and ERL2 (C) in the wild type (Col), and in ibm1-4 and edm2-4 mutants. Orange bars indicate the sites of cytosine methylation and the height of the bars indicates the relative DNA methylation level. The genomic regions where bisulfite sequencing was performed are underlined. (D-G) Epi-fluorescence images of 3-dpg adaxial cotyledon of Col (D), er105 (E), ibm1-4 (F) and ibm1-4 er105 (G). The double mutant resembles er105. Cell outlines are marked by FM1-43 staining. Scale bar: 30 μm (in D, for D-G). The images in D and F are also shown in Fig. 1A and Fig. 1D, respectively, because these experiments were performed concurrently. (H) Histogram showing the ratio of the total number of small dividing cells relative to that of the pavement cells in different genotypes. (I) Quantification of the total number of stomata and small dividing cells. Data in H and I are mean±s.d. *P<0.05, **P<0.01, compared with the wild type (Col) by Student's t-test with Bonferroni correction (n=6).

