Fig. 6.
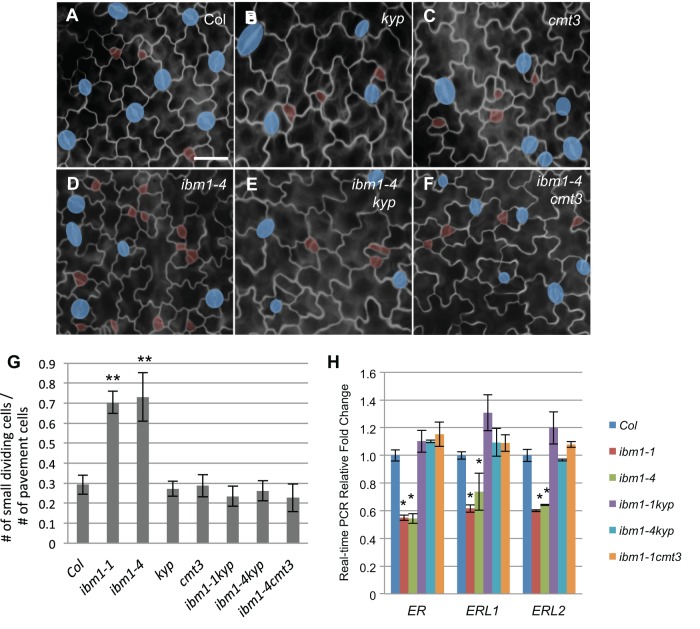
cmt3 and kyp4 mutations suppress the stomatal defects in ibm1 mutants. (A-F) Epi-fluorescence microscope images show 3-dpg adaxial cotyledons of Col (A), kyp (B), cmt3 (C), ibm1-4 (D), ibm1-4 kyp (E) and ibm1-4 cmt3 (F). The control image (A) is also shown in Fig. 3A because these experiments were performed concurrently. Scale bar: 30 μm (in A, for A-F). cmt3 and kyp were epistatic to ibm1 mutations. (G) Histogram displaying the ratio of the total number of small dividing cells over that of the pavement cells in different mutant backgrounds. *P<0.05, **P<0.01; one-way ANOVA with Bonferroni multiple comparison (n=6; ±s.d.). (H) Real-time PCR analyses for the expression level of ER genes in the indicated mutants. The expression fold changes were normalized to the transcript level in Col. Note the expression of ER genes recovered to the wild-type level when kyp and cmt3 were intragressed into the ibm1 mutants. *P<0.05, **P< 0.01 compared with the wild type (Col) by Student's t-test with Bonferroni correction (n=3 replicates).

