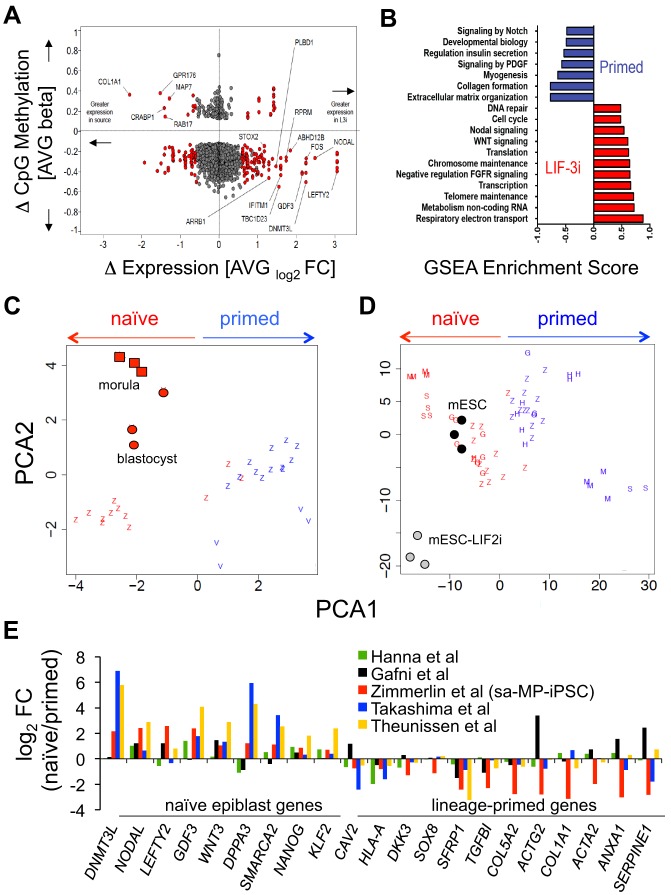
Fig. 5.
Comparative transcriptional/epigenetic meta-analyses of LIF-3i-reverted hPSCs. (A) Mean genome-wide gene expression versus CpG methylation DMRs crossplot of LIF-3i-reverted hPSCs versus their isogenic primed hPSC counterparts [same 12 samples as in Fig. 4, i.e. hESCs (n=3), MP-iPSCs (n=6), fibro-iPSCs (n=3)]. Shown are DMRs (CpG beta values) of LIF-3-reverted versus isogenic primed hPSC counterparts (y-axis, P≤0.05) versus their corresponding differential gene expressions [red, x-axis, log2 fold changes (FC); P≤0.05, FC ±≥1.5]. (B) Curated GSEA reactome pathways over-represented (FDR<0.01; P<0.01) in LIF-3i-reverted sa-MP-iPSCs versus their isogenic primed sa-MP-iPSC counterparts (n=6; same samples as Fig. 4A). (C,D) Comparative platform-normalized PCA of whole-genome expression of primed (blue) or naïve (red) PSC lines from different laboratories. (C) Human morula/blastocyst (red circles) or (D) mESC-serum/mESC-LIF-2i (black/gray circles) samples were used as benchmarks. Human morula/blastocyst PCA in C is clustered on a module of the most differentially expressed genes in E4-E5 human pluripotent epiblast (Petropoulos et al., 2016) (see Table S1). Z, this study and includes the n=12 independent hPSC lines in Fig. 4A; H, Hanna et al., 2010; G, Gafni et al., 2013; M, Takashima et al., 2014; S, Theunissen et al., 2014; V, Vassena et al., 2011. (E) Comparison of differentially expressed (P≤0.05, FC±≥1.5) naïve-specific and lineage-primed transcripts in naïve hPSCs derived in this work or other labs. FC: normalized ratios of naïve/primed expression microarray signal intensities. Ratios are of LIF-3i-reverted versus primed hPSC samples (n=12 hPSCs, as above) versus samples of those published as indicated.

