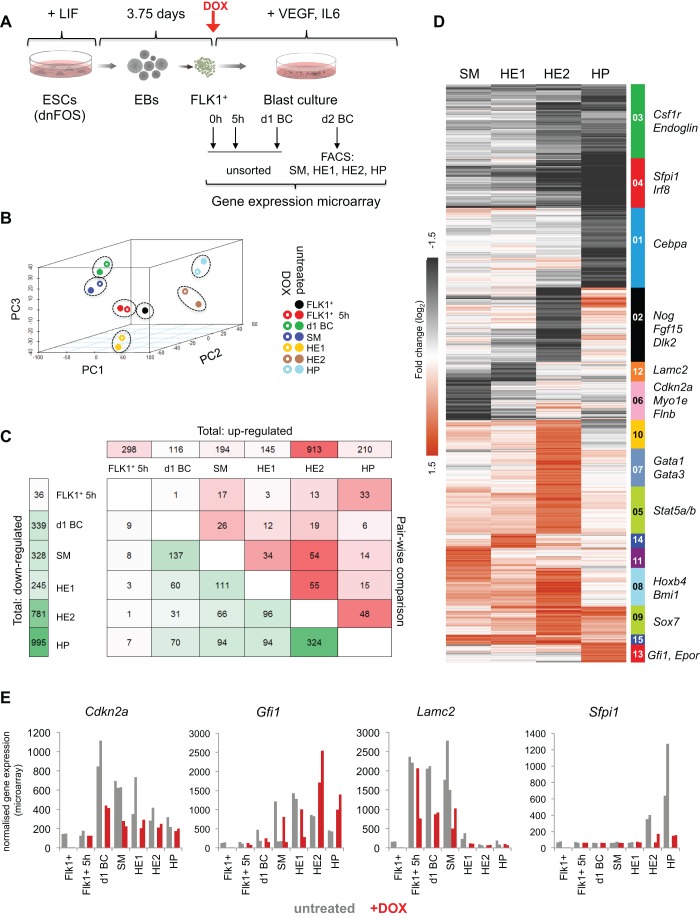
Fig. 3.
dnFOS induction causes distinct changes to global gene expression programmes. (A) Experimental setup: dnFOS ESCs were differentiated for 3.75 days as EBs. FLK1+ HB cells were purified and subsequently cultured with and without 1 µg/ml DOX under blast culture conditions for 5 h, 24 h or 48 h. Freshly purified FLK1+ cells (=0 h), 5 h and 1 day cultures with and without DOX induction were used directly for RNA extraction, whereas day 2 cultures with and without DOX induction were sorted by FACS into pure populations of SM, HE1, HE2 and HP cells prior to RNA extraction. RNA was used for genome-wide gene expression arrays. Each population was analysed in duplicate. (B) Principle component analysis with three components for all 13 indicated cell types. (C) Pairwise comparison of microarray data from untreated and DOX-treated cells. The numbers of significantly (at least twofold) up- and downregulated genes are shown. The numbers at the top indicate the genes that are upregulated (DOX versus untreated samples) for each time point, the numbers on the left represent genes that are downregulated (DOX versus untreated samples) for each time point. The numbers within the table show how many of the up-/downregulated genes at each time point are also mis-regulated (green, down; red, up) at other time points. (D) SM, HE1, HE2 and HP samples with and without DOX induction were used for k-means clustering by fold change of genes that change expression at least twofold upon dnFOS induction. For the resulting 15 clusters of genes, a heatmap was generated and some genes of interest are indicated next to their respective cluster. (E) Expression values of exemplary genes over the course of differentiation with and without DOX induction based on data from microarrays. Individual replicates for each sample are depicted.

