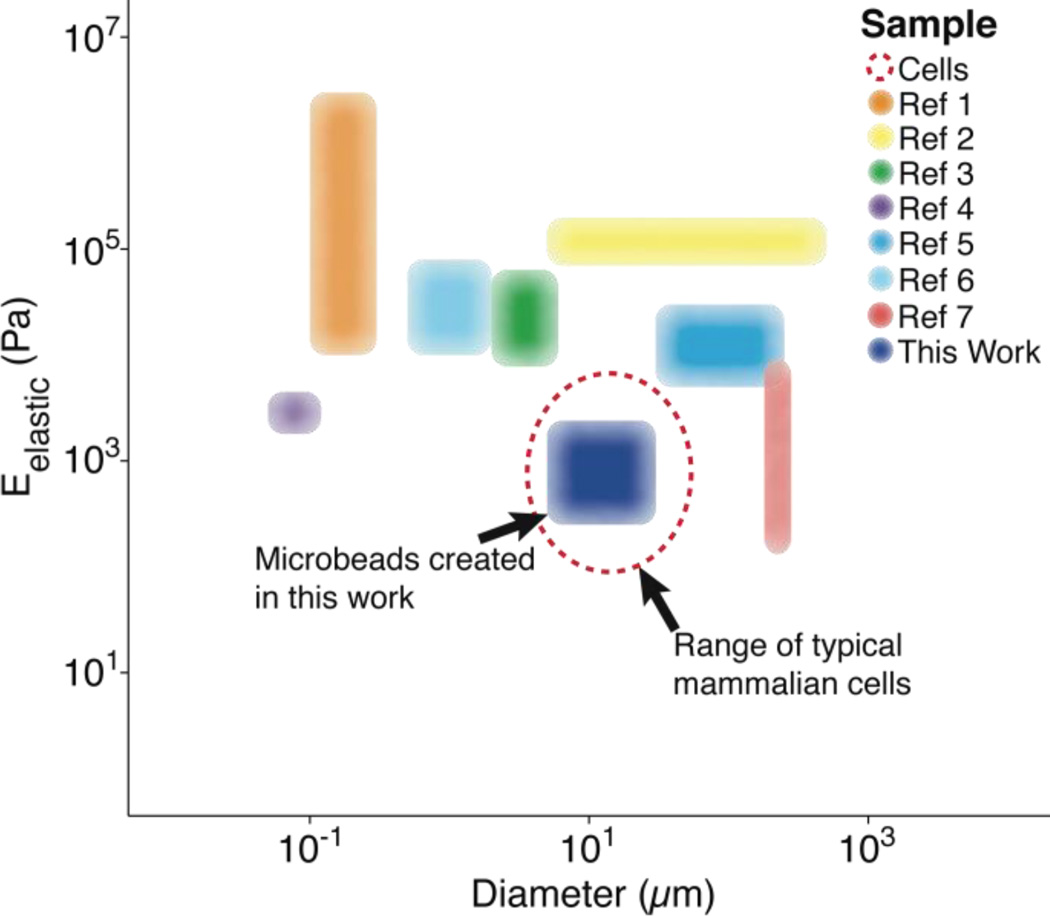
Fig. 1.
Previously reported particle/bead size and elasticity ranges. Each region represents the span of microbead diameters and elastic moduli documented in other studies alongside that developed for this work (dark blue).9 The dashed, red line represents the approximate diameter (~10 µm) and elastic moduli (~1 kPa) associated with mammalian cells in their spherical morphology.8 *Reference 9 contains each of the references from the legend of this figure, in order.

