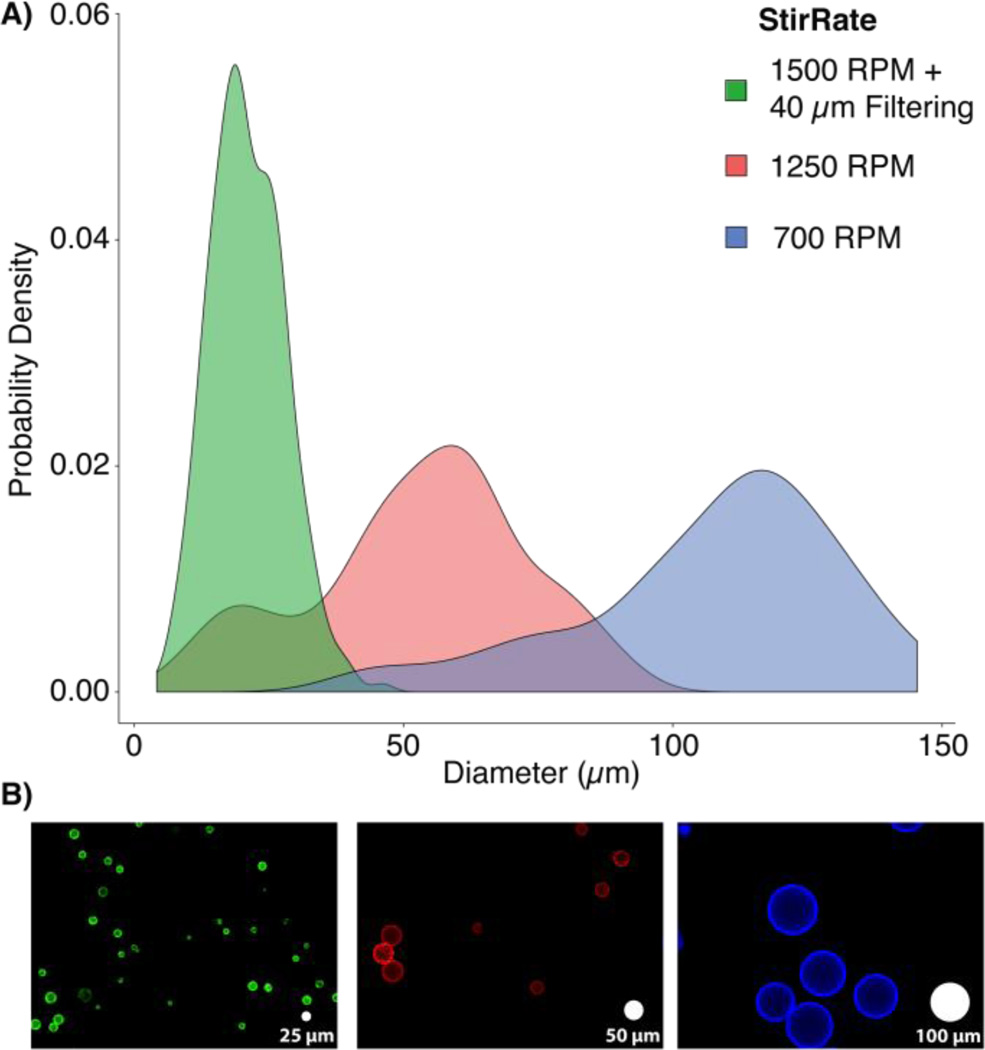
Fig 2.
Microbead size distributions for various stir rates: A) The population density histograms for microbeads generated using 0.1% bis-acrylamide at 1500 RPM with 40 µm filtering (green, 20 ± 7 µm), 1250 RPM (red, 48 ± 20 µm), and 700 RPM (blue, 104 ± 24 µm) show the expected inverse relationship between stir speed and particle size. The inclusion of 40 µm filtering yielded a much more monodisperse population within the target size range by removing large beads and aggregates. B) Representative images of each bead population (false colored to match the distribution plots) show bead sizes relative to white “scale microbeads” with 25, 50, and 100 µm diameters (left to right).

