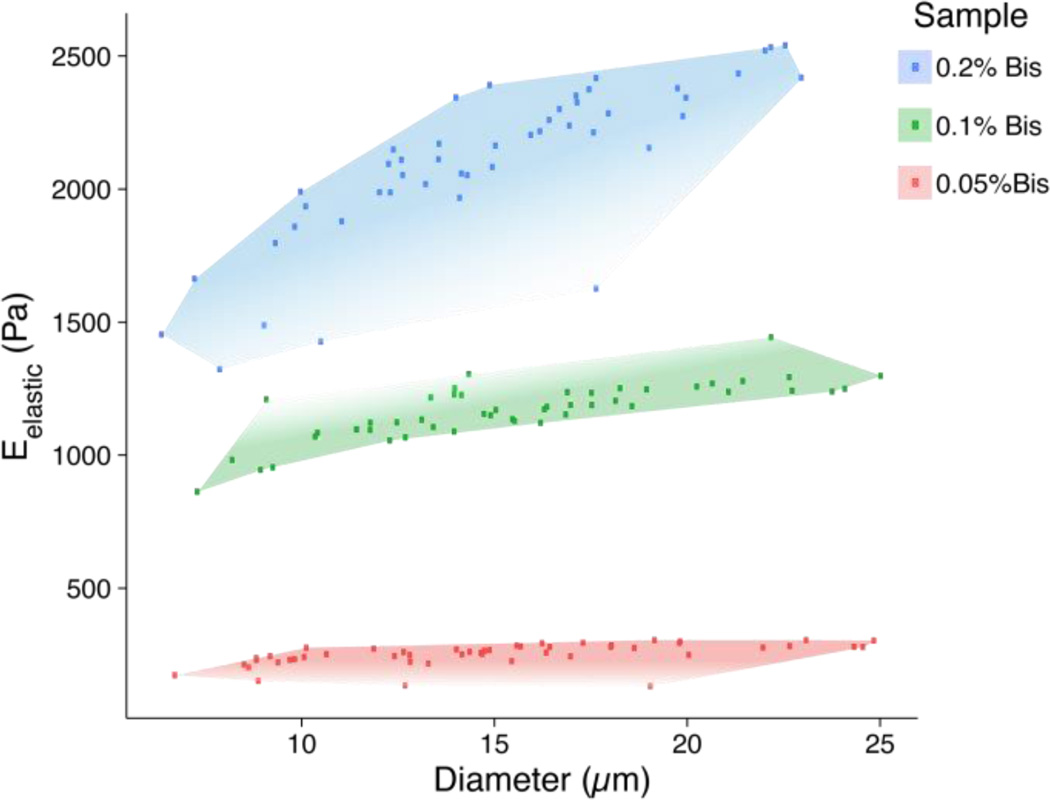
Fig. 3.
Microbead elasticity and size distributions measured by atomic force microscopy. This scatter plot illustrates the ranges of sizes and elastic moduli for each PAAm formulation. The red region represents the most compliant 0.05% bis-acrylamide formulation (250 ± 10 Pa, 14 ± 5 µm), green represents 0.1% bis-acrylamide (1200 ± 100 Pa, 15 ± 4 µm), and blue represents 0.2% bis-acrylamide (2100 ± 300 Pa, 14 ± 4 µm).

