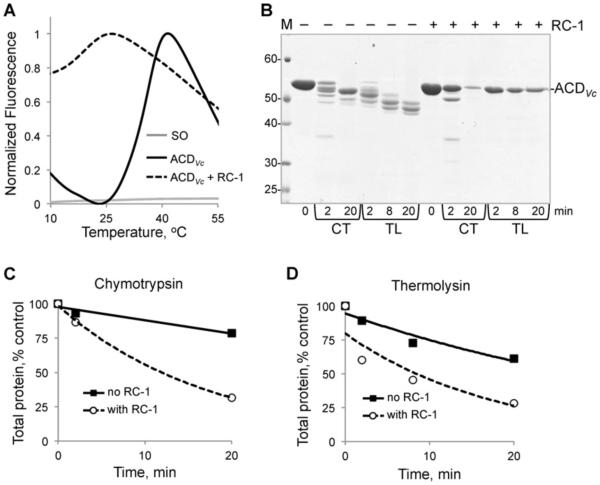
Figure 2. Effects of RC-1 on ACDVc toxin.
(A) DSF of ACDVc (final concentration 10 μM) was carried out in the presence (dashed line) or absence (solid black line) of 5 fold mole excess of RC-1 (50 μM). SO dye alone (solid grey line). (B) Limited proteolysis of 8.7 μM ACDVc in the absence and presence of 5 fold mole excess RC-1 (44 μM). Samples were incubated at 30 °C in the presence of chymotrypsin (CT) or thermolysin (TL) for the indicated periods of time and subjected to SDS/PAGE. Position of the full-length ACDVc is indicated on the gel. M, molecular mass ladder (values in kDa). (C and D) Quantification of total protein content (sum of all bands in a lane) for CT (C) and TL (D) proteolysis.

